


Stock Insights is a widget powered by Tijori that gives you an overview of the fundamentals of stocks in your portfolio.
How to view Stock Insights
- Login to Console.
- Click on Portfolio and then on Holdings.
- Click on Options.
- Click on View insights.
Information displayed in Stock Insights
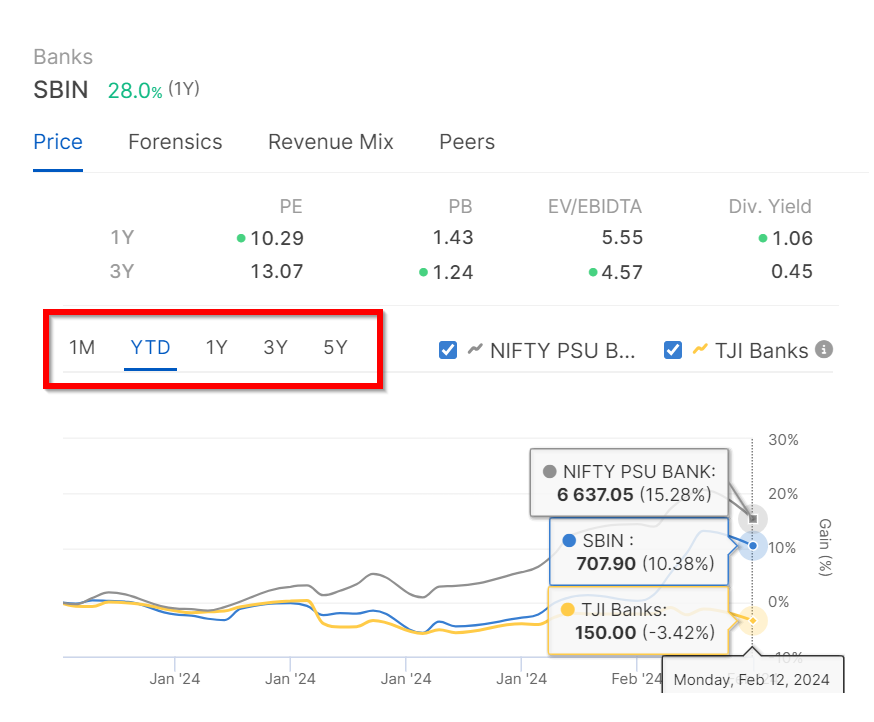
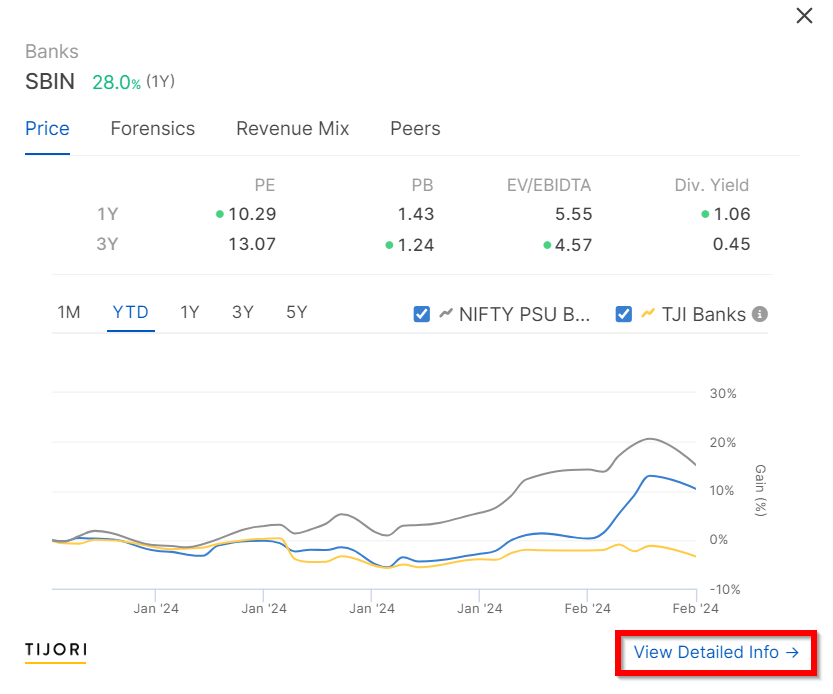
Price: The performance of stock prices can be checked over various periods, including 1-month, year-to-date, 1-year, 3-year, and 5-year intervals. This performance can be compared with the sectoral index corresponding to the stock. For instance, the performance of SBIN against the Nifty PSU bank index over the last 5 years is displayed as follows:
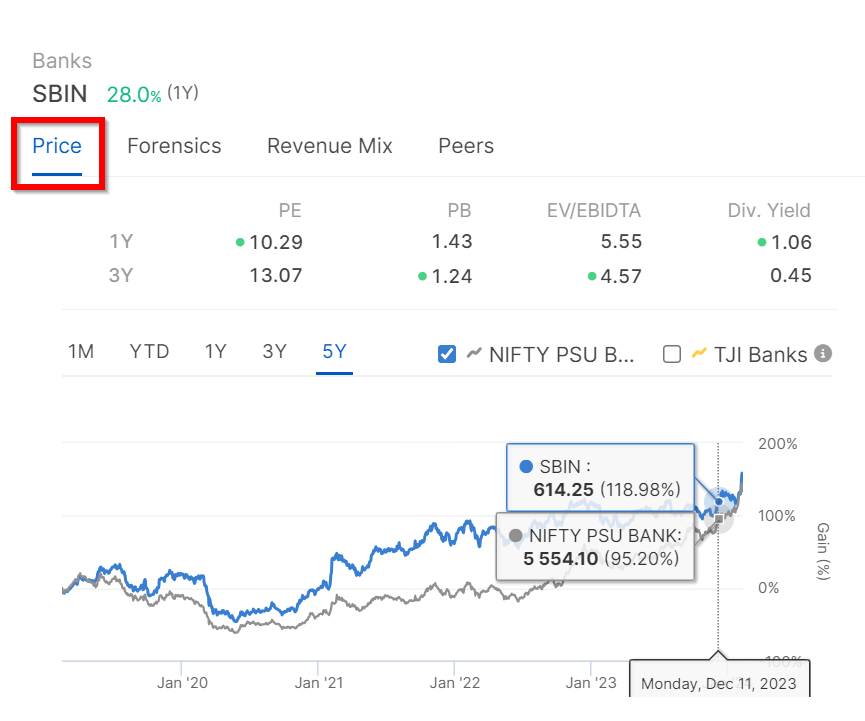
A comparison can also be made with a custom index by Tijori Finance, which is constructed using the market cap and revenue exposure of companies in the sector.

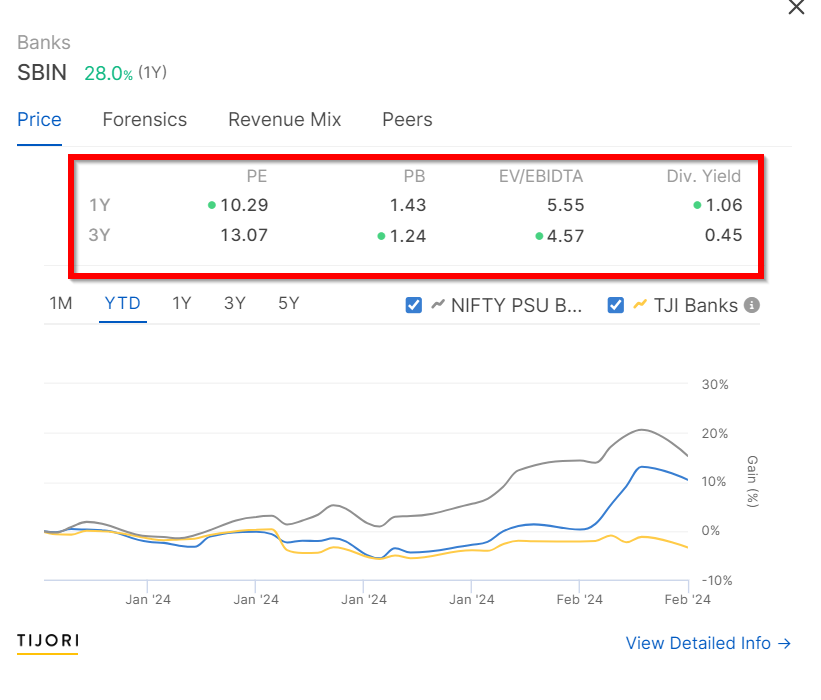
The detailed information, such as the price chart, can be viewed by clicking on
View Detailed Info.
Forensics: Forensics offer valuable metrics and indicators that help in assessing a company's financial health and performance. However, not all data points are applicable to every stock, leading to variations in these metrics for banks, insurance companies, and non-banks. For instance, the forensics for SBIN displays ROE, Current vs Historic Valuation, Net NPA and Net Interest Margin.

All the red flags can be checked by clicking on
See All Red Flags.

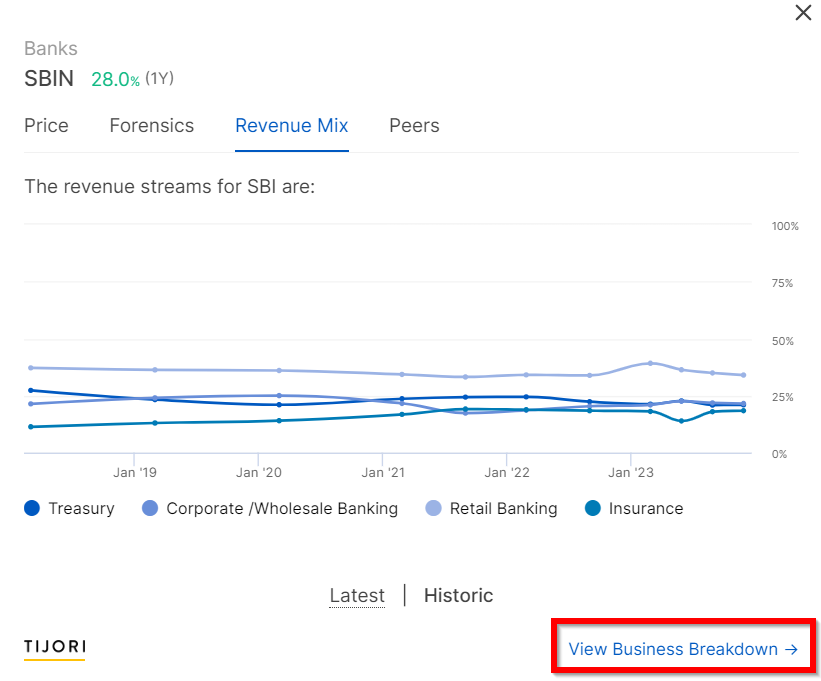
Revenue mix: Revenue mix provides an overview of how each service, department or product contributes to a company's revenue, especially for those businesses that offer multiple products and services across various sectors.

Historical data can be checked to observe how the revenue mix has evolved over the past five years by clicking on
Historic.
The revenue breakdown for a specific quarter can be seen by hovering over the lines in the line chart.

Further breakdown can be viewed in detail by clicking on View Business Breakdown.
Peers:
The Peers section provides an overview of the company's performance against its peers, showing you the Price-to-earnings ratio, Market Capitalisation, Return on Equity and Debt to Equity ratio.

Detailed information can be accessed by clicking on View Detailed Info.
