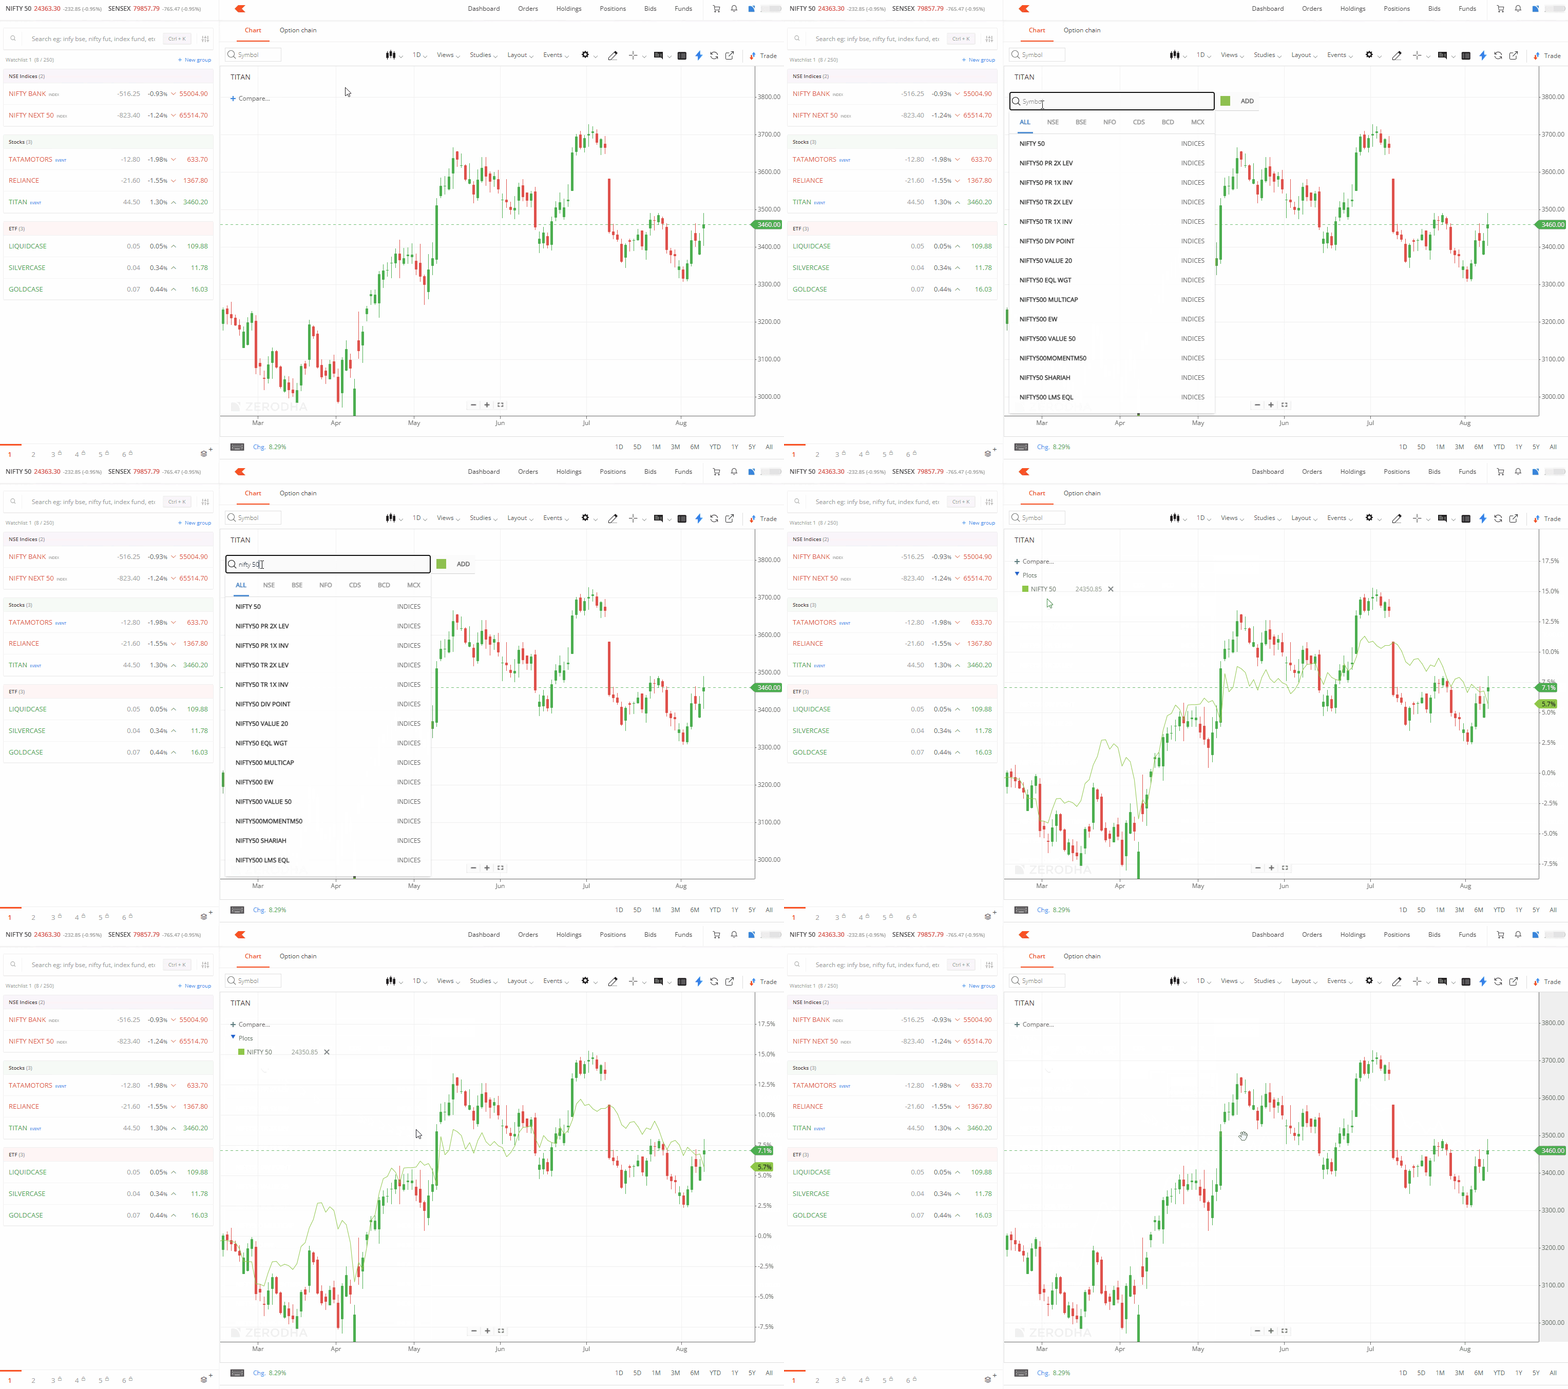
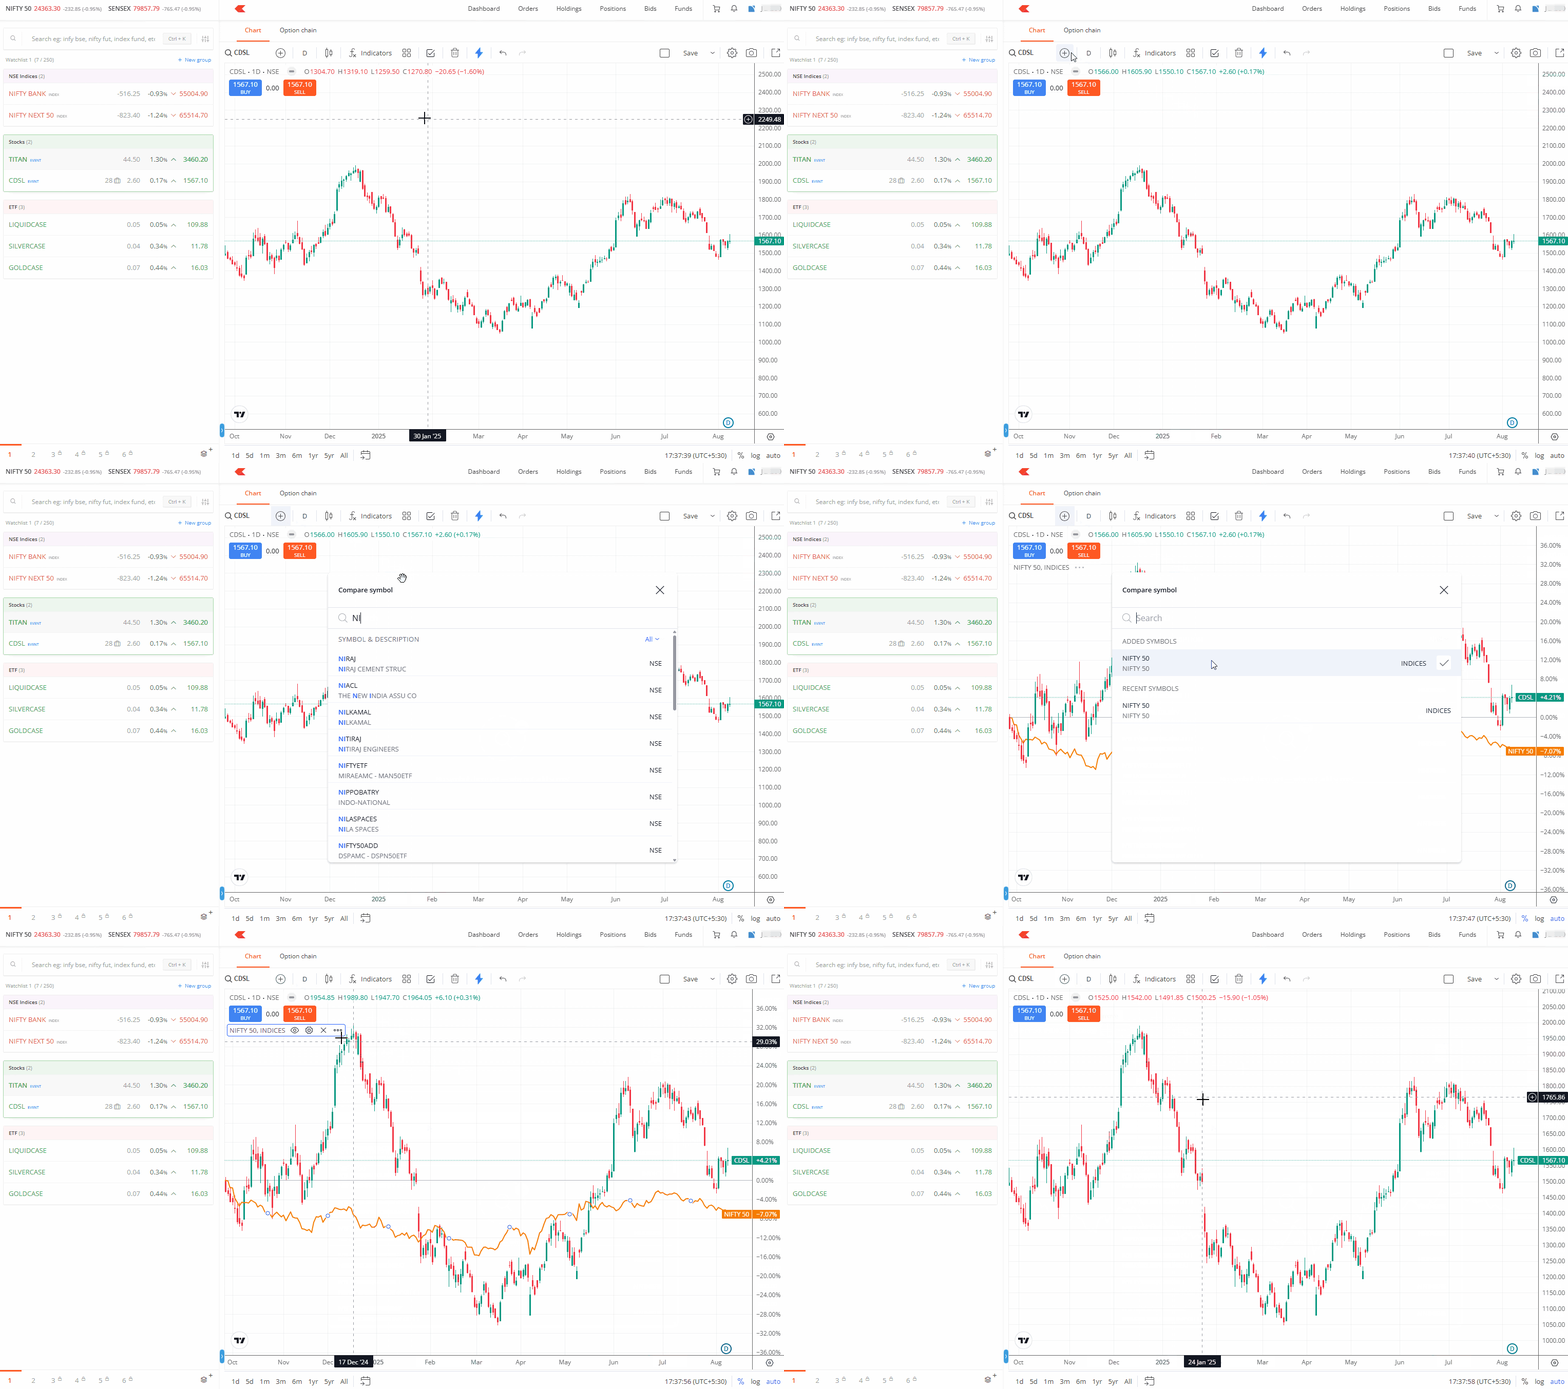
You can compare the relative performance of stocks and indices on Kite using the compare option on charts. This feature shows comparison as a percentage from the starting price to the current price.
ChartIQ
- Click on Compare.
- Enter the name of the instrument and click on it.

To remove the comparison, right-click on the Comparison line and select the delete option.
TradingView
- Click on Compare.
- Enter the name of the instrument and click on the instrument.
- To remove the comparison, right-click on the Comparison line and click on Remove.

Things to keep in mind
- You cannot view live ticks while using the compare feature.
- This feature is available only on Kite web and will be available on the app soon.


