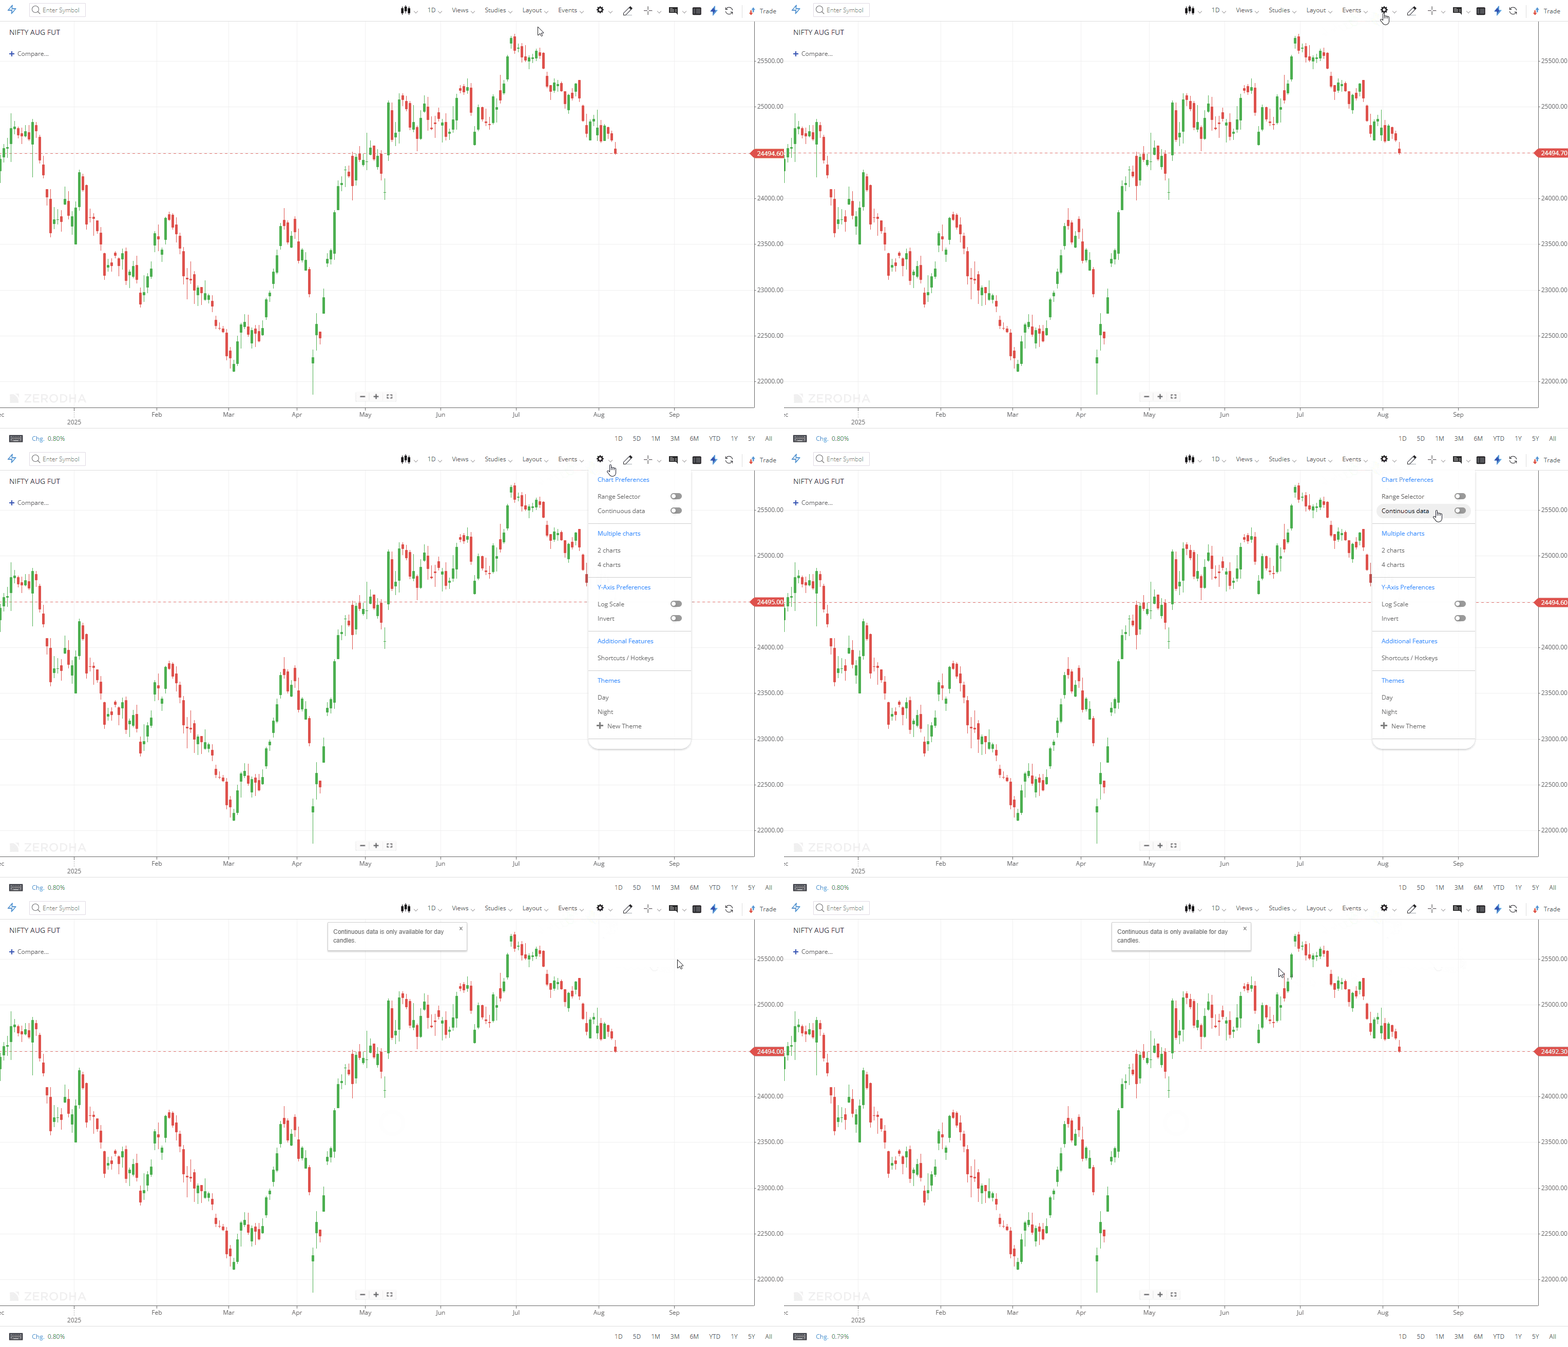
You can view continuous chart data for futures contracts on Kite to analyse longer historical trends beyond the typical three-month contract lifespan.
- Click on Display.
- Select Continuous data.

Continuous data is available only for daily candles.
What is a continuous futures chart?
Continuous futures charts combine data from current, near, and far month contracts instead of individual monthly contracts. Since futures expire within three months, individual contracts provide only three months of data.
These charts use current month data (Nifty April futures in April, Nifty March futures in March) to create longer historical charts. You can access continuous charts in ChartIQ and TradingView.
Why is there no continuous options chart?
You cannot create continuous charts for options because they operate differently from futures contracts. Futures maintain constant intrinsic value between months, but options behave differently. All at-the-money (ATM) and out-of-the-money (OTM) options expire worthless, reaching zero value.


