What are the features available on the new Chart IQ?
The features that are available on the new Chart IQ are as follows:
-
Custom timeframe
Charts can now be analysed with candles of custom time frames such as 7 minutes, 125 minutes etc.

-
Shortcut keys for various functions.
Chart shortcuts are now available on ChartIQ 8. Shortcuts can be used to quickly perform actions such as invoking the order window, accessing drawing tools, zooming, etc.

-
Chart data to Excel
Chart data can now be downloaded in CSV format. The data will be downloaded in the current timeframe of the chart that has been selected.

-
Chart to backtest powered by Streak
Streak allows you to create and backtest trading strategies without any coding. Streak is now integrated with Kite charts. Clicking on the Streak icon will start a backtest of widely used strategies with the indicators applied on the charts. A maximum of ten free backtests can be used per day. A streak subscription is required for more. To learn more, see How to use the backtest feature on Kite Charts?

-
New drawing tools
New drawing tools such as Elliott wave, Magnet, Volume profile by date range are now available.

-
Tool tip
Historical indicators values can now be seen along with open, high, low and close valued (OHLC) in the info box.

-
Pin favourite tool
Frequently used drawing tools can now be marked as favourites and can be accessed quickly at the top of the drawing tools menu.

-
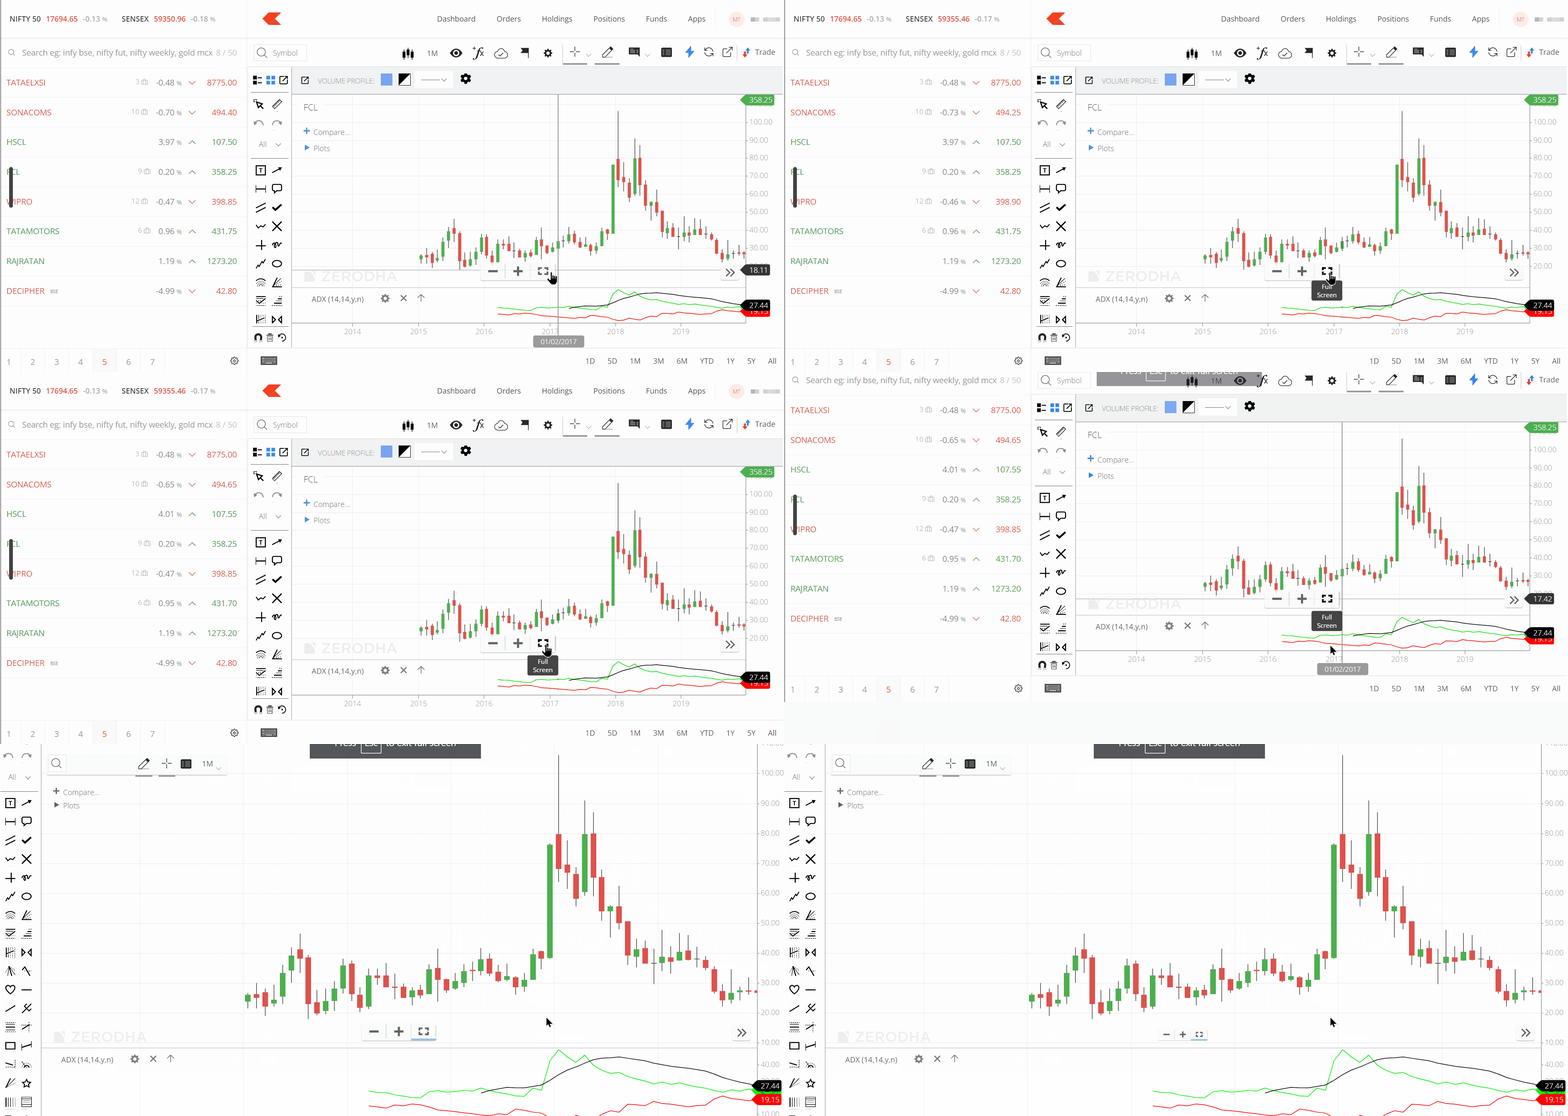
Fullscreen feature
Charts can now be viewed in fullscreen mode for a larger view.

-
New indicators
New indicators such as Projected Aggregate volume, Projected Volume at time, Volatility Projection Cone, Moving Average Cross, Guppy Multiple Moving Average, Enhanced anchored VWAP are now available.
- Continuous chart data is now available for currency contracts.
Did you know?
New Chart IQ won't be available for users with Android 7 and below.
Still need help?
×
![]()


