


You can track your portfolio performance, dividends, red flags on your holdings, top contributors to your returns, and a timeline of key events related to your stocks from the Analytics section on the holdings page.
To access Analytics:
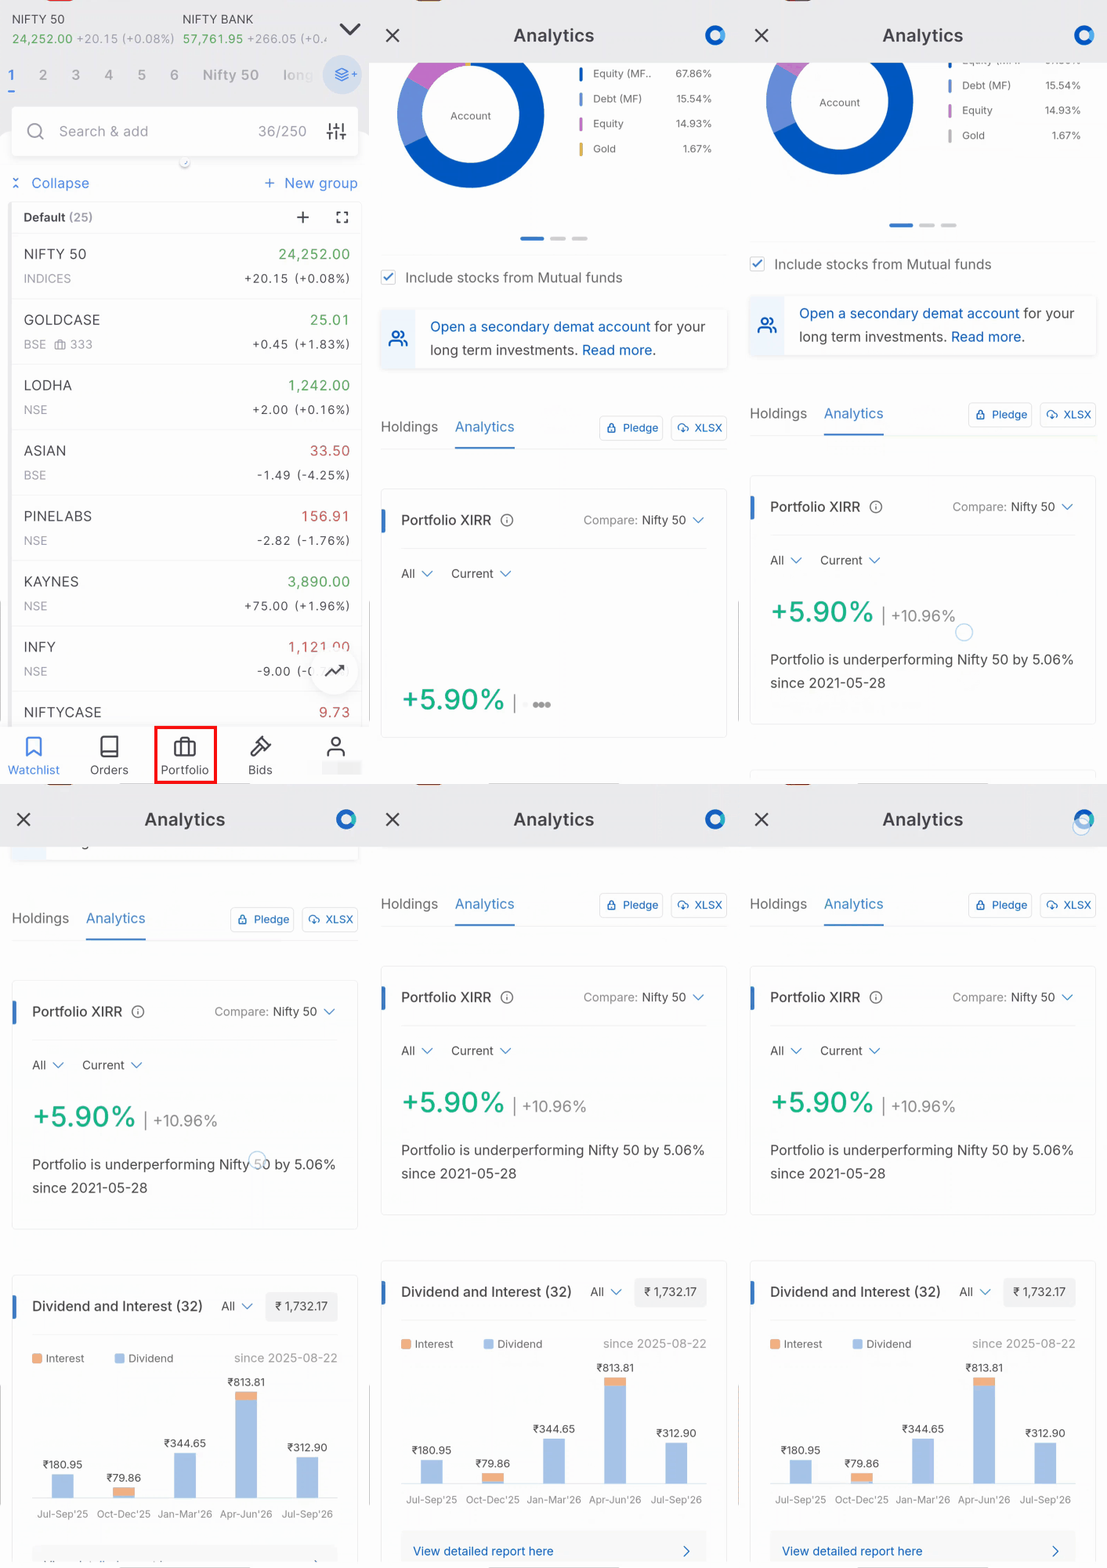
Kite app
- Tap on Holdings.
- Tap on Analytics.
Kite web
- Click on Holdings.
- Click on Analytics.
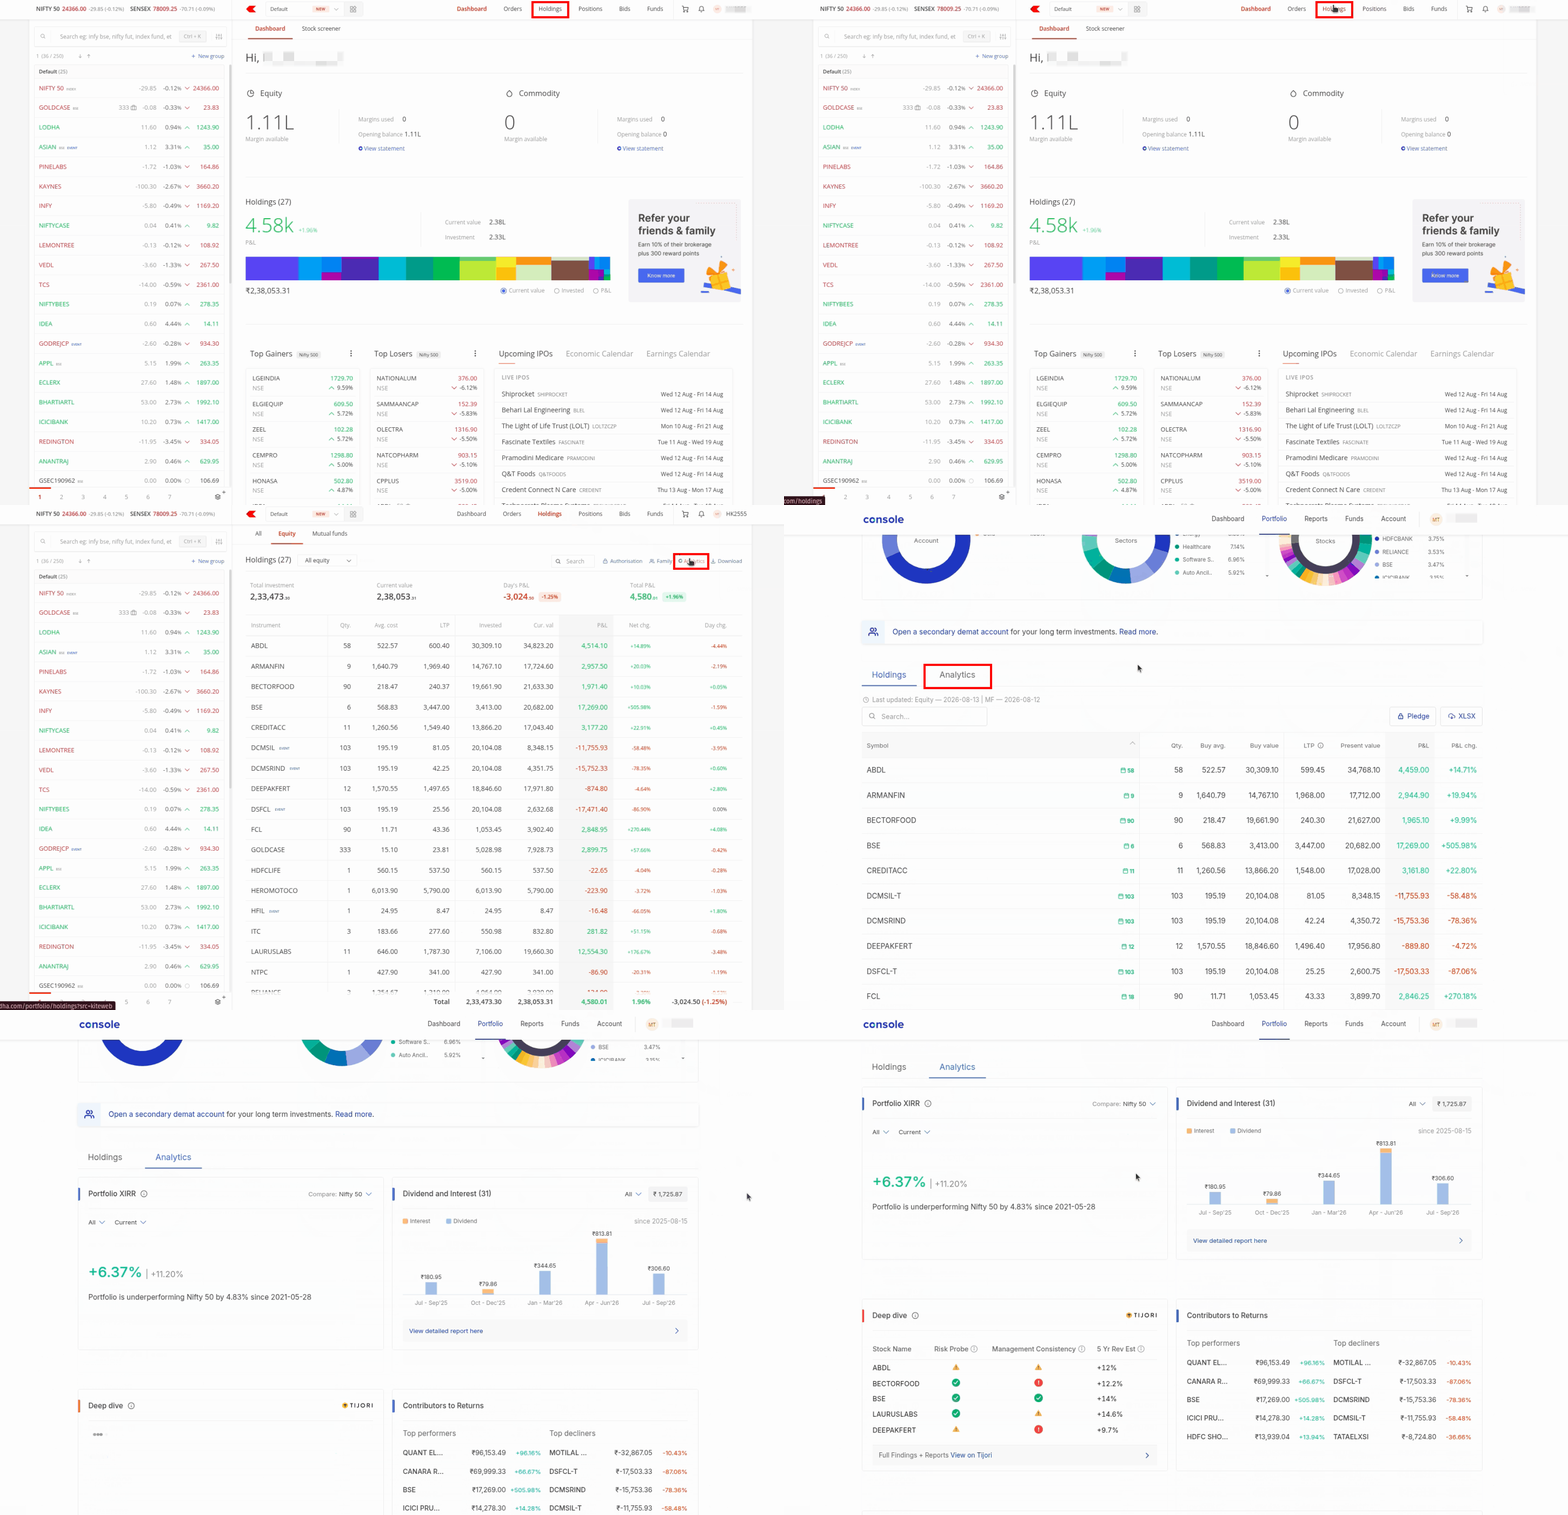
You can also access it directly by visiting console.zerodha.com/portfolio/holdings and then clicking on Analytics.
Filters
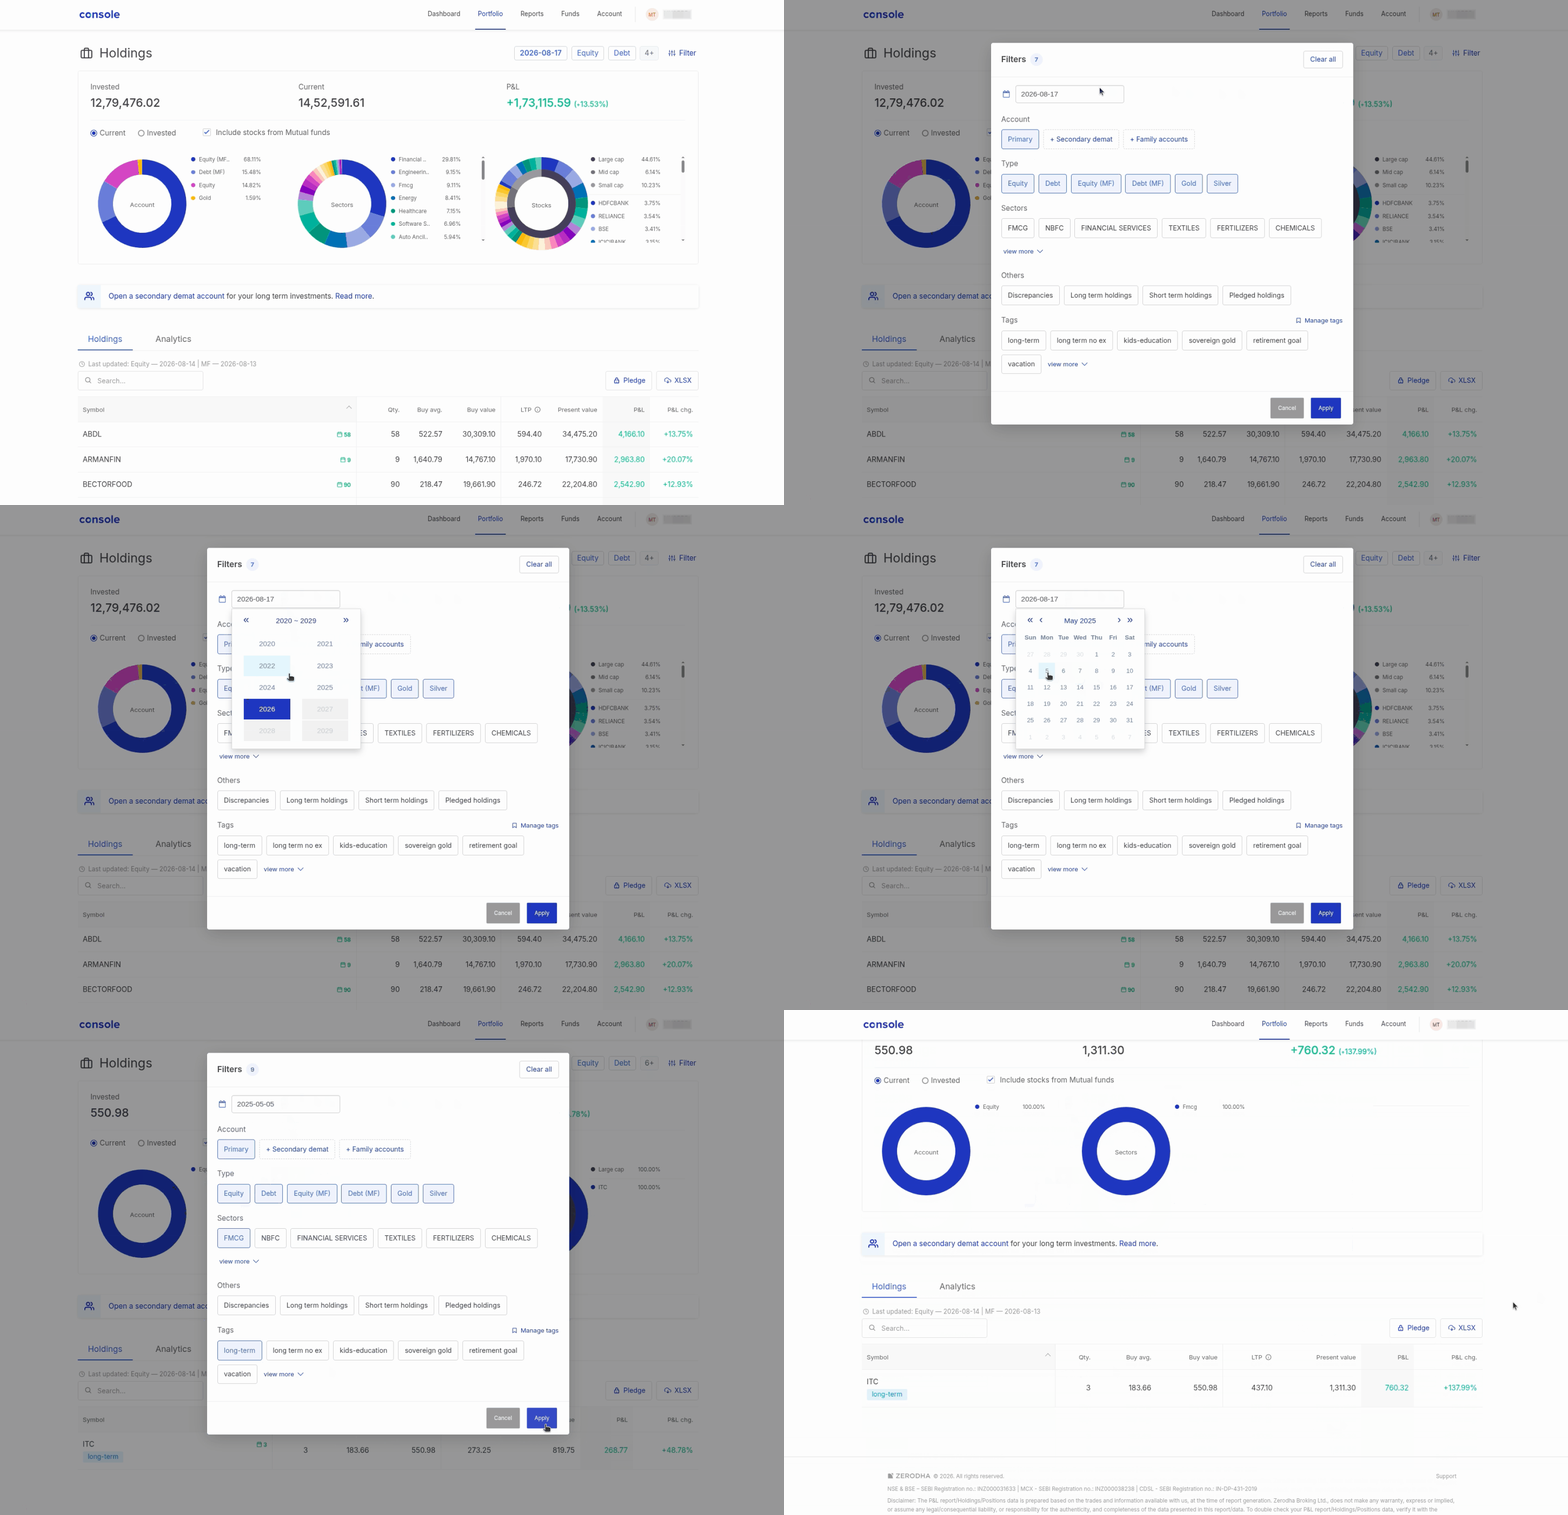
The filter box on the Console holdings page allows you to categorise and review your portfolio holdings across accounts, asset classes, sectors, holding types, and tags.
Filter options
- Date: Click on the calendar dropdown to select a specific historical date (e.g., 21 August 2026) and view your holdings as of that day.
- Account: Filter holdings by the account entity choose from Primary, Secondary demat, or Family accounts.
- Type: Narrow down holdings by asset category, such as Equity, Debt, Equity (MF), Debt (MF), Gold, and Silver.
- Sectors: Filter stocks by industry sectors, such as FMCG, NBFC, Financial Services, Textiles, Automobile, etc. Click on View more or View less to toggle the full sector list.
- Others: Filter holdings based on specific states, such as Discrepancies, Long term holdings, Short term holdings, or Pledged holdings.
- Tags: Filter holdings by custom labels such as long-term, kids-education, or tax-saving. Click on Manage tags to edit them.
How to apply and clear filters
- Select your desired criteria across one or multiple filter categories. The blue counter badge next to Filters displays the total number of active filters selected (e.g., 7).
- Click on Apply to update the holdings table with the selected filters, or click on Cancel to discard the changes.
Active filters will appear as tags next to the Filters button on the main view. To reset all selections, click on Clear all inside the filter box.
Portfolio XIRR
Portfolio XIRR (Extended Internal Rate of Return) shows your annualised returns based on your current holdings. You can use it to measure how well your investments have performed over time, especially when you have made multiple investments at different times, such as through Systematic Investment Plans (SIPs).
You can view your portfolio XIRR for three categories: Equity (stocks only), MF (mutual funds only), and Combined (stocks and mutual funds together). To track how your returns have changed over time, you can switch between Current, which calculates returns based on the current breakdown of your holdings, and Historical, which calculates annualized returns by considering all historical trades since your account opening date.
To benchmark your performance, you can compare your portfolio XIRR against the following indices:
- Nifty 50
- Nifty Midcap 150
- Nifty Largemid 250
- Nifty Smlcap 250
- Nifty 500
- Nifty GS Composite
This comparison helps you understand whether your portfolio is outperforming or underperforming relative to broader market indices.
If the majority of your investments are less than a year old, the XIRR may appear inflated and a "-" is displayed instead.
Dividend and interest
The dividend and interest chart shows you a visual breakdown of all the dividends and interest payments you have received on your holdings over time. You can view this data as quarterly bars that separate dividend income from interest income, making it easy to track your passive earnings.
You can filter the view by All, Dividends, or Interest. The total dividend and interest amount is displayed at the top of the section. Click on View detailed report here to see a complete breakdown of each payment.
Deep dive (red flags)
The Deep dive section, powered by Tijori, highlights potential red flags in your stock holdings. This feature analyses the financial health of each company in your portfolio and flags areas that may need your attention.
Key Metrics & Indicators
- Risk Probe : Surfaces governance, accounting, financial health, regulatory, and operational red flags, with each finding directly traceable back to a regulatory filing.
- Management Consistency : Tracks and matches management's past guidance and commitments against actual reported outcomes to evaluate credibility.
- 5-Yr Rev Est (5-Year Revenue & EBITDA Estimates): Provides bottom-up forward projections across Bear, Base, and Bull scenarios complete with probability bands and CAGRs.
Users can click View on Tijori at the bottom of the table to access full detailed findings and reports. For a more detailed analysis, you can visit tijorifinance.com .
Under each metric, visual status indicators help you quickly assess stock risk levels:
- Green Checkmark (Healthy): Indicates no major concerns.
- Yellow Warning Sign (Caution): Indicates potential issues worth a closer look.
- Red Exclamation Mark (Elevated risk): Highlights specific concerns flagged during analysis.
Contributors to returns
The Contributors to returns section shows you which stocks have had the most impact on your portfolio performance. It is divided into two columns:
- Top performers: The stocks that have contributed the most positive returns to your portfolio, showing the stock name, current value, and percentage gain.
- Top decliners: The stocks that have had the most negative impact on your portfolio, showing the stock name, current value, and percentage decline.
This helps you quickly identify which investments are driving your gains and which ones are dragging your portfolio down.
Portfolio timeline
The Portfolio timeline is a chronological feed of key events and developments related to the stocks in your portfolio, powered by Tijori. Previously available on the Console dashboard, you can now access it directly from the Analytics tab on the holdings page.
The timeline tracks events such as:
- Quarterly earnings announcements, including AI-generated summaries of results
- Corporate actions like dividends, bonuses, and stock splits
- Regulatory developments and exchange filings
- Insider trading activity (promoter buying or selling)
- Changes in debt levels or capital expenditure
- News and developments that affect your holdings
You can use the timeline to stay informed about your holdings without switching between multiple websites and apps. When a company announces quarterly results, an AI-generated summary automatically appears on the timeline, covering revenue, profit, key drivers, and changes from the previous quarter. You can also check the exchange filing directly from the timeline.