The Day's range shows you the lowest and highest prices of an instrument for the trading day, helping you quickly assess the stock's daily performance.
How the Day's range works
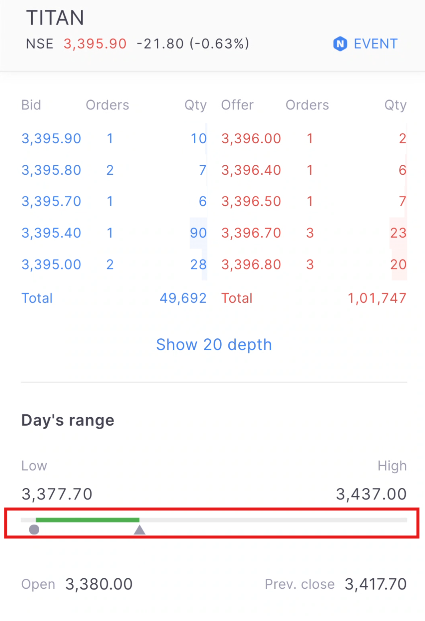
The Day's range displays a visual line that compares the stock's opening price to the Last Traded Price (LTP):
- Green line: LTP is higher than the opening price
- Red line: LTP is lower than the opening price
- ▲ indicates the LTP
- ⬤ indicates the opening price