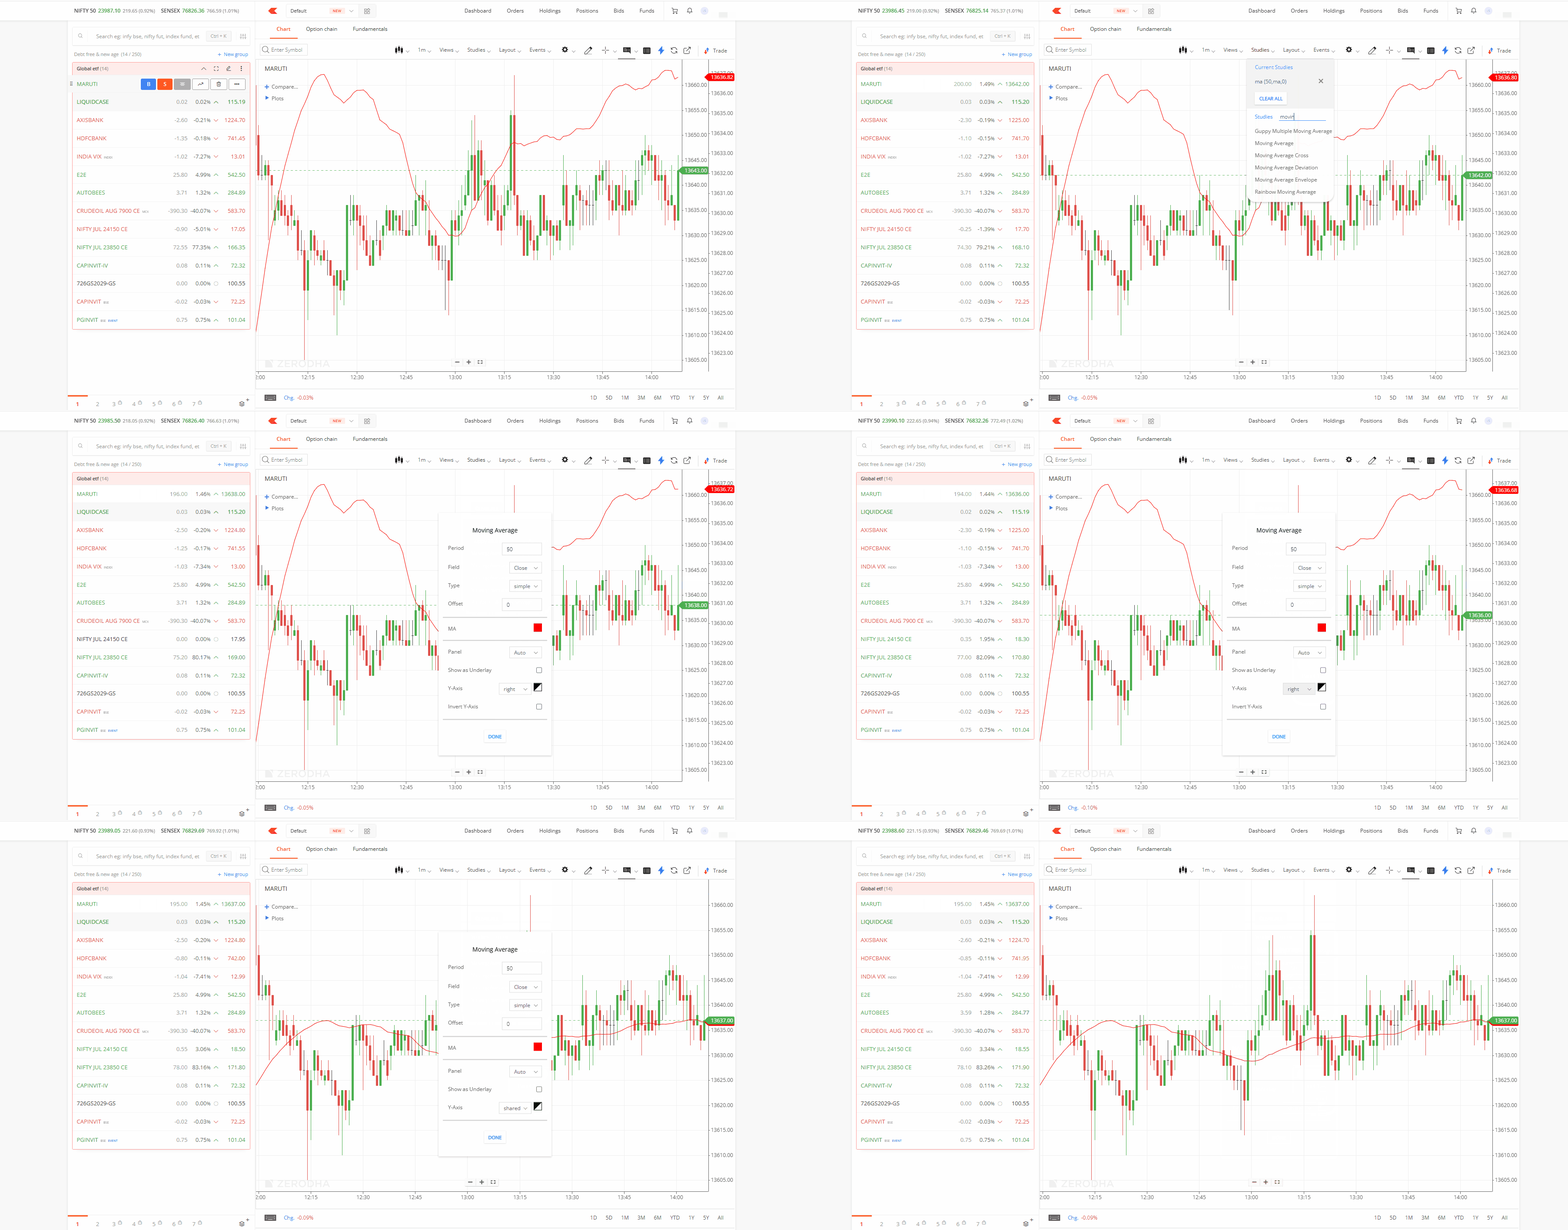
When you place an indicator (for example, a moving average) on a separate axis, it uses an independent price scale instead of sharing the main chart scale. Since these scales calculate their ranges independently, the values on the side axis do not align visually with the actual stock or contract prices on your chart.
To sync the indicator with the main price scale on Chart IQ, follow these steps
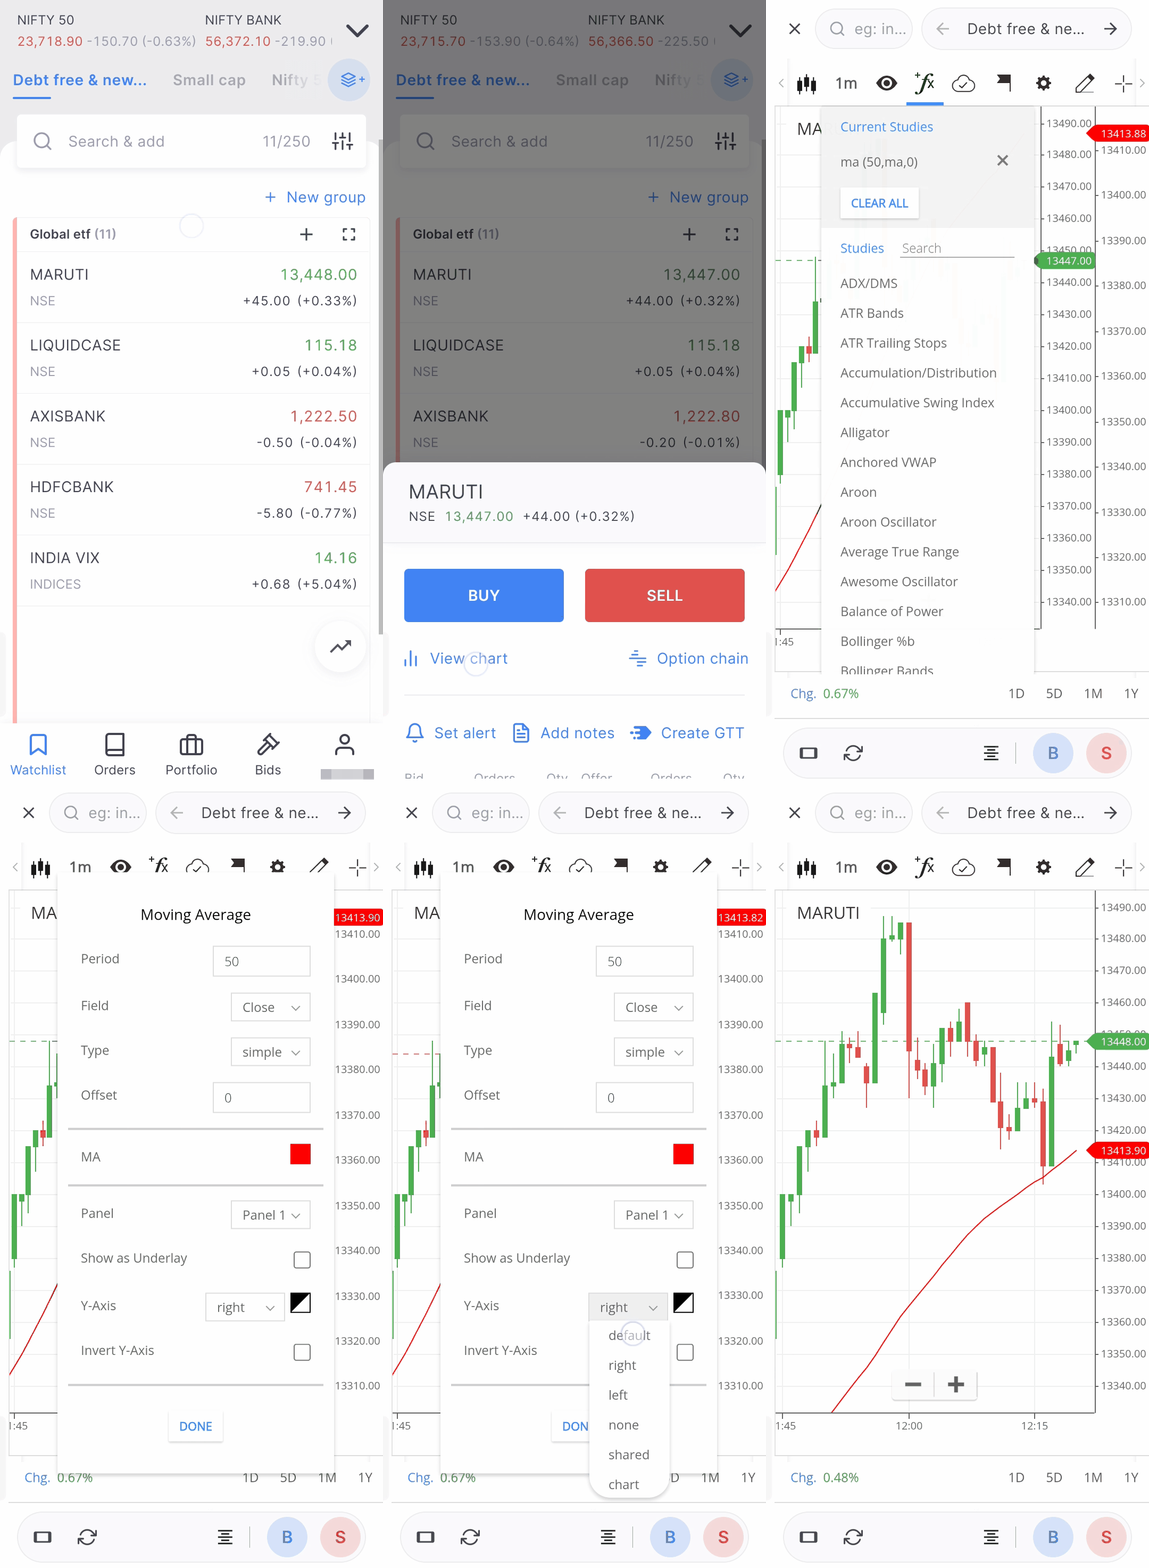
On the Kite app
- Tap on any security in the watchlist and tap on View Chart.
- Tap on the indicator, then tap on the Settings (gear) icon that appears on the screen.
-
In the indicator settings, go to the Style or Visibility tab (depending on the indicator).
- Set Panel to Auto and Y-Axis to Default.
-
Tap on Done.
On the Kite web
- From the watchlist, hover over any security and click on Chart.
-
Click on
Studies
, and select the
indicator.
- Set Panel to Auto and Y-Axis to Default.
-
Click on
Done.