How to use the backtest feature on Kite Charts?
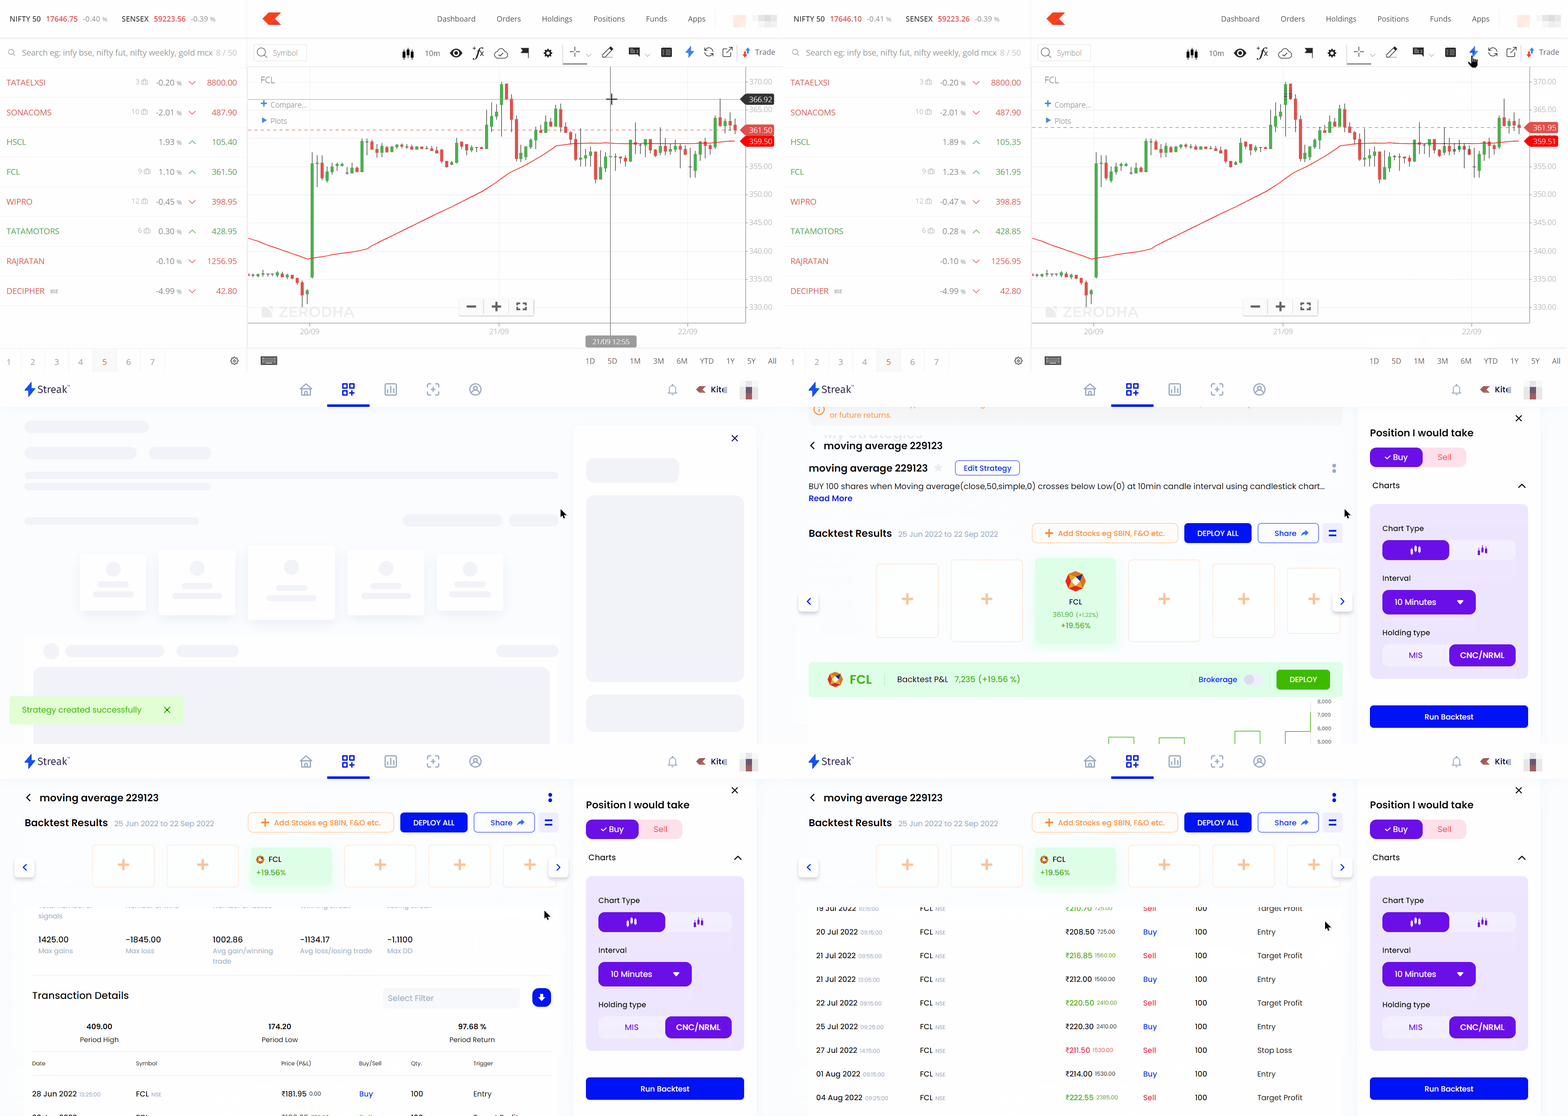
Chart to backtest (CTB), powered by Streak, converts the plotted chart and indicators into a set of conditions and generates a backtest result. To backtest, click on the Streak icon.
Kite app

Kite web

If an unsupported indicator is used, the backtest will be performed based on the price action strategy. A maximum of 10 free backtests can be run per day. A streak subscription is required to run more than ten backtests and edit the strategies.
List of indicators supported in CTB:
- Money Flow Index
- ADX
- Moving Averages
- Williams %R
- Stochastics
- Moving Average Deviation
- Supertrend
- Bollinger Bands
- PSAR
- Pivot Points (Standard)
- volume
- MACD
- CCI
- VWAP
- Detrended
- ATR
- Aroon
- Aroon Osc
- On Bal Vol
- Momentum Indicator (MOM)
-
RSI
The supported timeframes are 1, 3, 5, 10, 15, 30 minutes, 1 hour, and day candle. If a backtest is run on an unsupported timeframe, it will adjust to the nearest supported timeframe. This can be used only Candlesticks and Heikinashi chart types. Candlesticks will be considered if any unsupported chart type is selected.
To learn more about CTB, visit help.streak.tech/ctb.
Did you know?
- BSE and BCD (BSE Currency) segments are not supported.
- CTB is not to be construed as trading or investment advice. Zerodha does not recommend any indicators or strategies. The CTB function on Kite charts is to help clients understand how an instrument has performed over a period of time in a user-friendly format.
Still need help?


