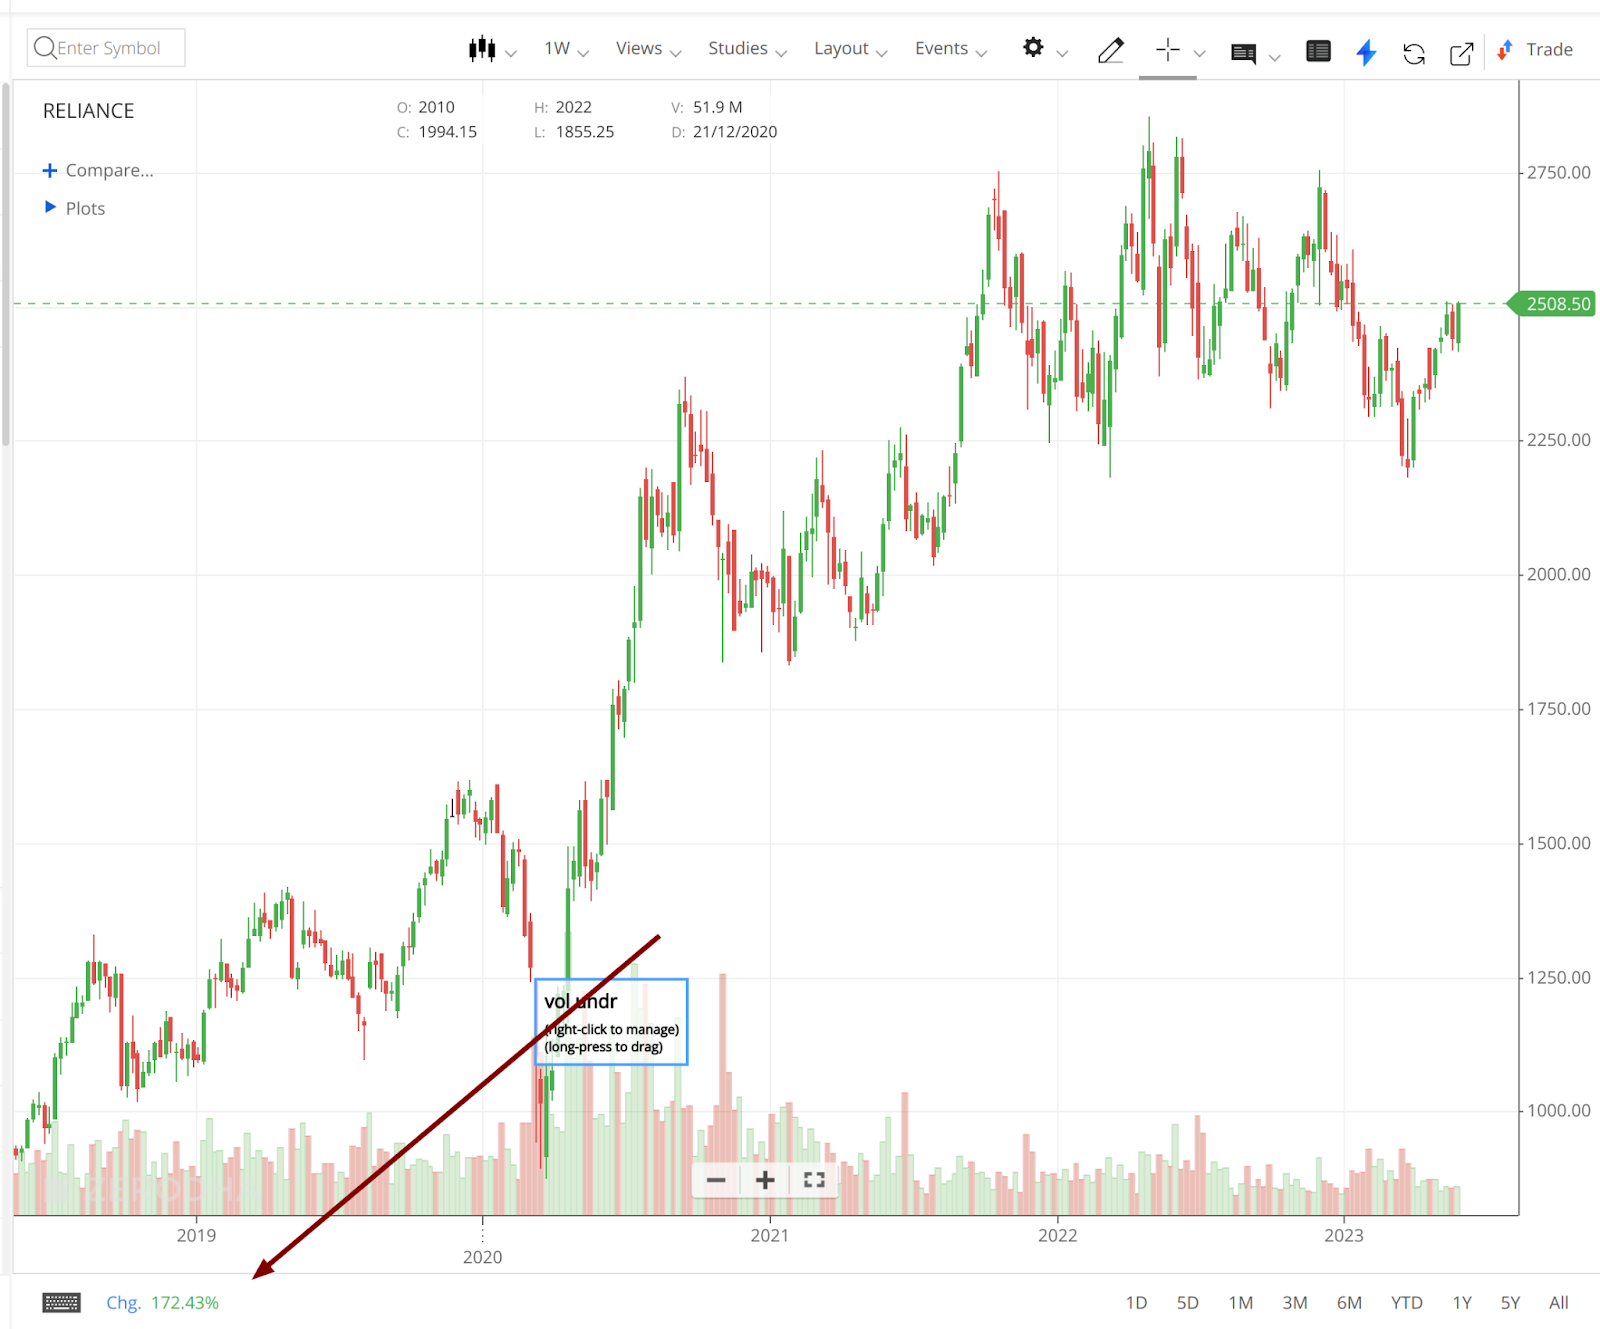
The displayed percentage change represents the percentage movement of the candles visible on the screen. It calculates the difference between the first candle's open value and the last candle's close value. For instance, when selecting a 5-day range, the percentage change for the last 5 days will be displayed. This is useful for visualising the percentage movement within the chosen time frame.