


The intraday candles on Kite charts are formed using live data from the exchange, which may not record all the transactions that took place in the interval. On the other hand, the daily candles are updated on the exchange bhavcopy data. To learn more, see Why are the OHLC values on daily and hourly charts different?
If an intraday chart is opened, the charting engine will only have historical intraday data points and will not have daily data points. So, to find the previous day's Open, High, Low, and Close (OHLC) the intraday chart will look at all the candles on the previous day and then take these points. So in a 5 minutes chart, the charting engine will have only 5 minutes data points historically, not 1-day data points. Therefore, to find the previous day’s OHLC, the 5-minute chart will look at all the candles from the previous day and then take these points. This may lead to a difference between pivot points calculated manually and pivot study on Kite charts.
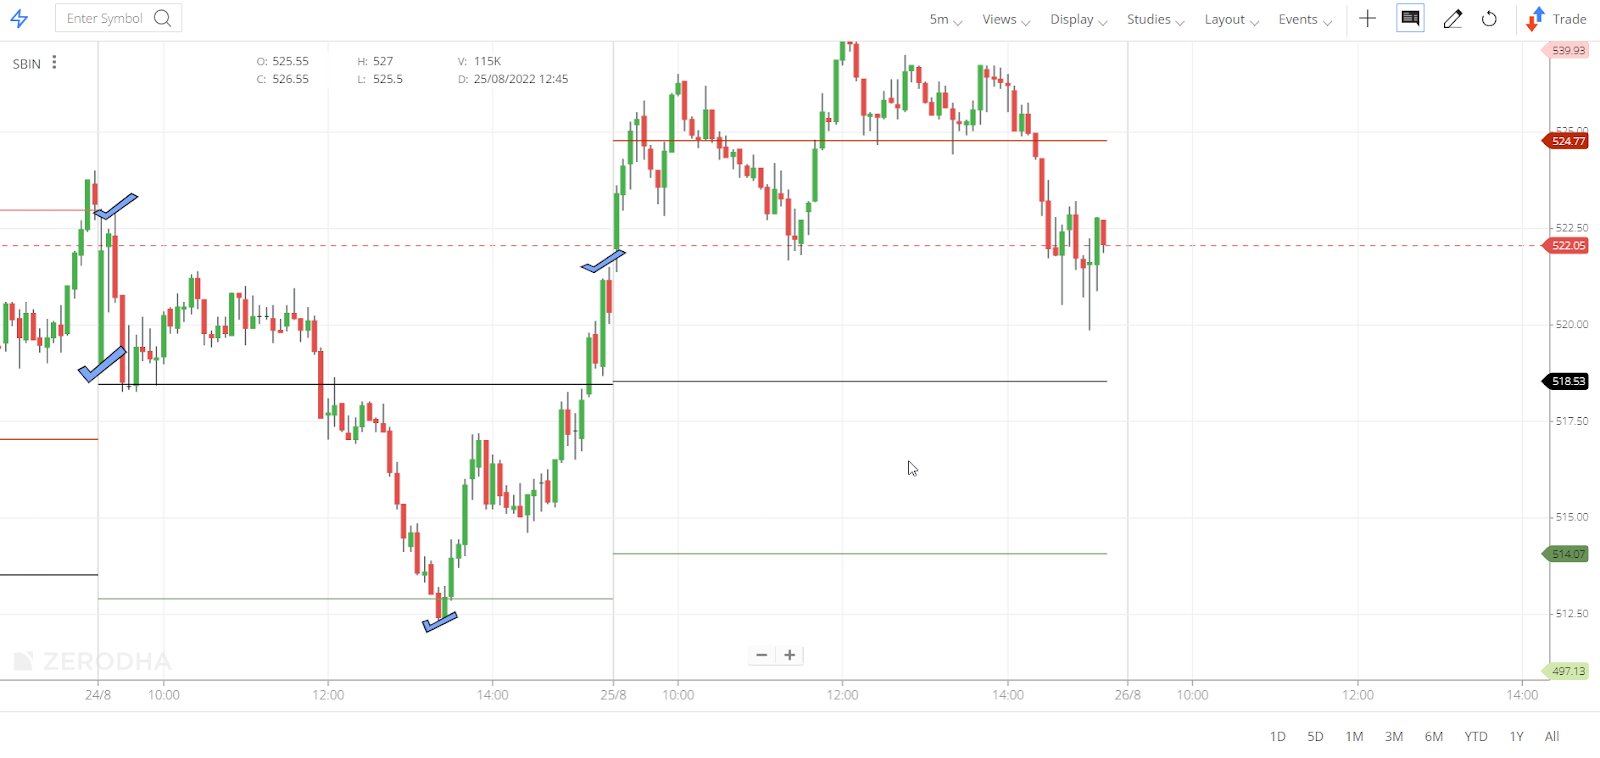
- The chart of SBIN on 24/08/2022 (the previous day) has it's Open (O) - 519, High (H) - 523, Low (L) - 512.3, and Close (C) - 519.3.
- On 25/08/2022, the pivot point data was 518.53. i.e. (H+L+C ÷ 3)
-
Here if the pivot point data is ascertained from the OHLC data of 25/08/2022, it will not match with the pivot points as it is calculated using the previous day’s OHLC.
The formula for calculating pivot points is mentioned below with an example on Kite ChartIQ.
Assume XYZ’s stock has its High (H) - 129.7, Low (L) - 126.9 and Close (C) - 127.35, respectively. So the pivot points in Kite would be calculated as follows :
| Kite (ChartIQ) |
|
| Pivot point = (H + L + C) / 3 | 127.98 |
| First support level (S1) = (2 * P) – H | 126.27 |
| Second support level (S2) = P – (H – L) | 125.18 |
| Third support level (S3) = P – 2*(H-L) | 122.38 |
| First resistance level (R1) = (2 * P) – L | 129.07 |
| Second resistance level (R2) = P + (H – L) | 130.78 |
| Third resistance level (R3) = P + 2*(H – L) | 133.58 |
Things to keep in mind
- On the TradingView chart, the OHLC points from the daily candles are always in sync with the exchange data, and there will be no mismatch between the TradingView pivot data and the pivot points calculated manually.
- On ChartIQ, the previous day's OHLC values are derived from the candle data of the timeframe currently selected on the chart. For example, on a 15-minute chart, the previous day's OHLC is calculated using the previous day's 15-minute candle data.