


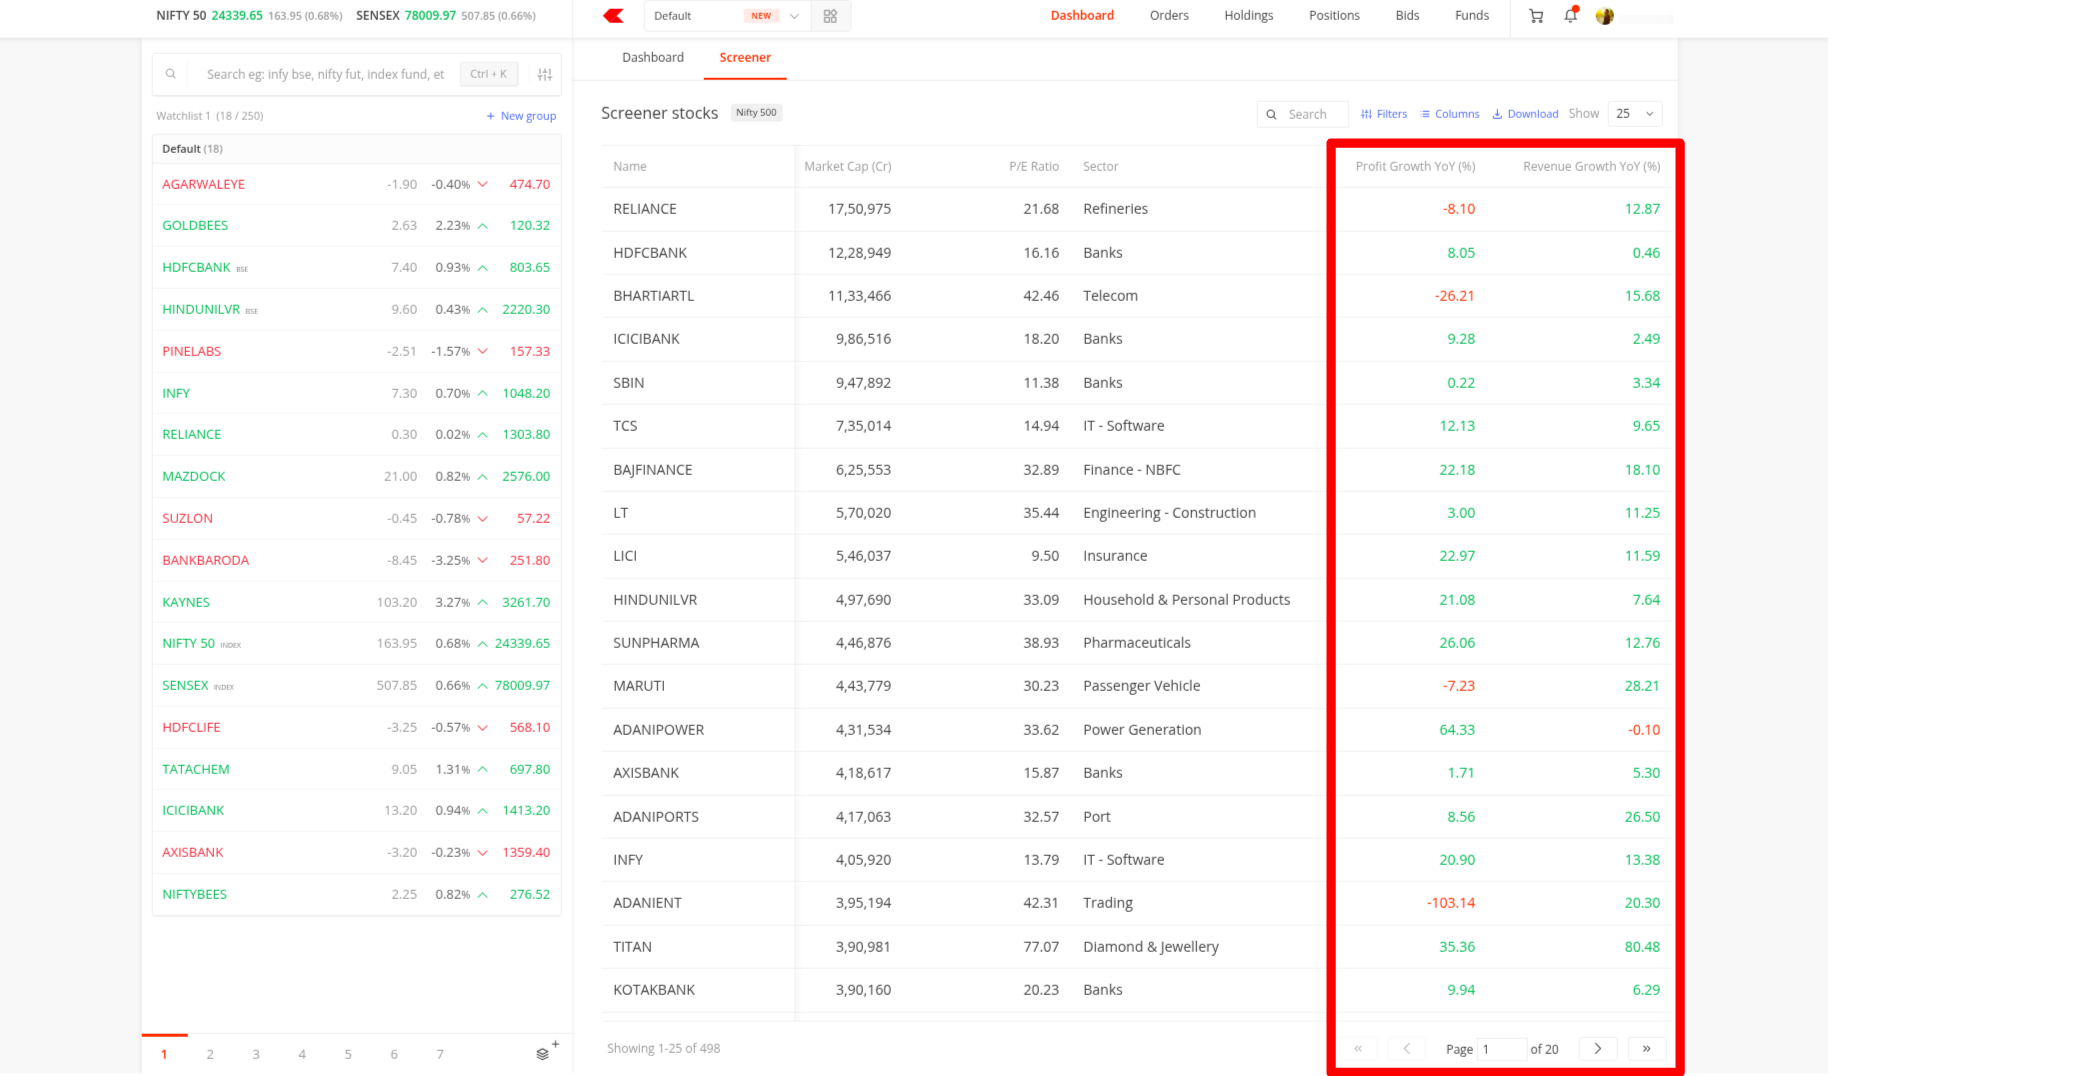
You can read all your screening results in the Kite screener's results table,sort them by any metric, and choose which columns you see. The table shows your results, whether you apply your own filters or start from a ready-made preset screener.
The Name column stays fixed on the left, and all data columns line up alongside it. By default, you see the following columns:
- Last price
- Percentage change
- Market capitalisation in crores
- P/E (Price to Earnings) ratio
- Sector
Kite colour-codes profit growth and revenue growth, showing green for positive figures and red for negative figures.
You can drag any column header to reorder or resize your view. Each column also has a pin icon, and when you click on it, that column anchors next to the Name column and stays fixed there until you unpin it, so you cannot move it accidentally. When you click on a column header, the table sorts in ascending or descending order by that metric.
Table controls
At the top right of the table, you get four controls:
- The Search bar, where you type a stock name or symbol and the table narrows down in real time. Click on the X to clear it.
- The Edit Columns option, which opens a panel where you turn individual columns on or off. You can use the Select All checkbox to enable everything at once, or pick the specific metrics you need. When you turn on a new column, it loads to the right of your existing columns.
- The download button, which exports your current results as a spreadsheet.
- The Show dropdown, which controls how many stocks appear per page. Your options are 25, 50, and 100.
To move between pages, use the page controls at the bottom. You get arrows to move forward, move backward, jump to the first page, or jump to the last page. You can also click directly on the page number, type the page you want, and press Enter to load it.
When you find a stock worth a closer look, you can open its full details and place an order directly from the table.