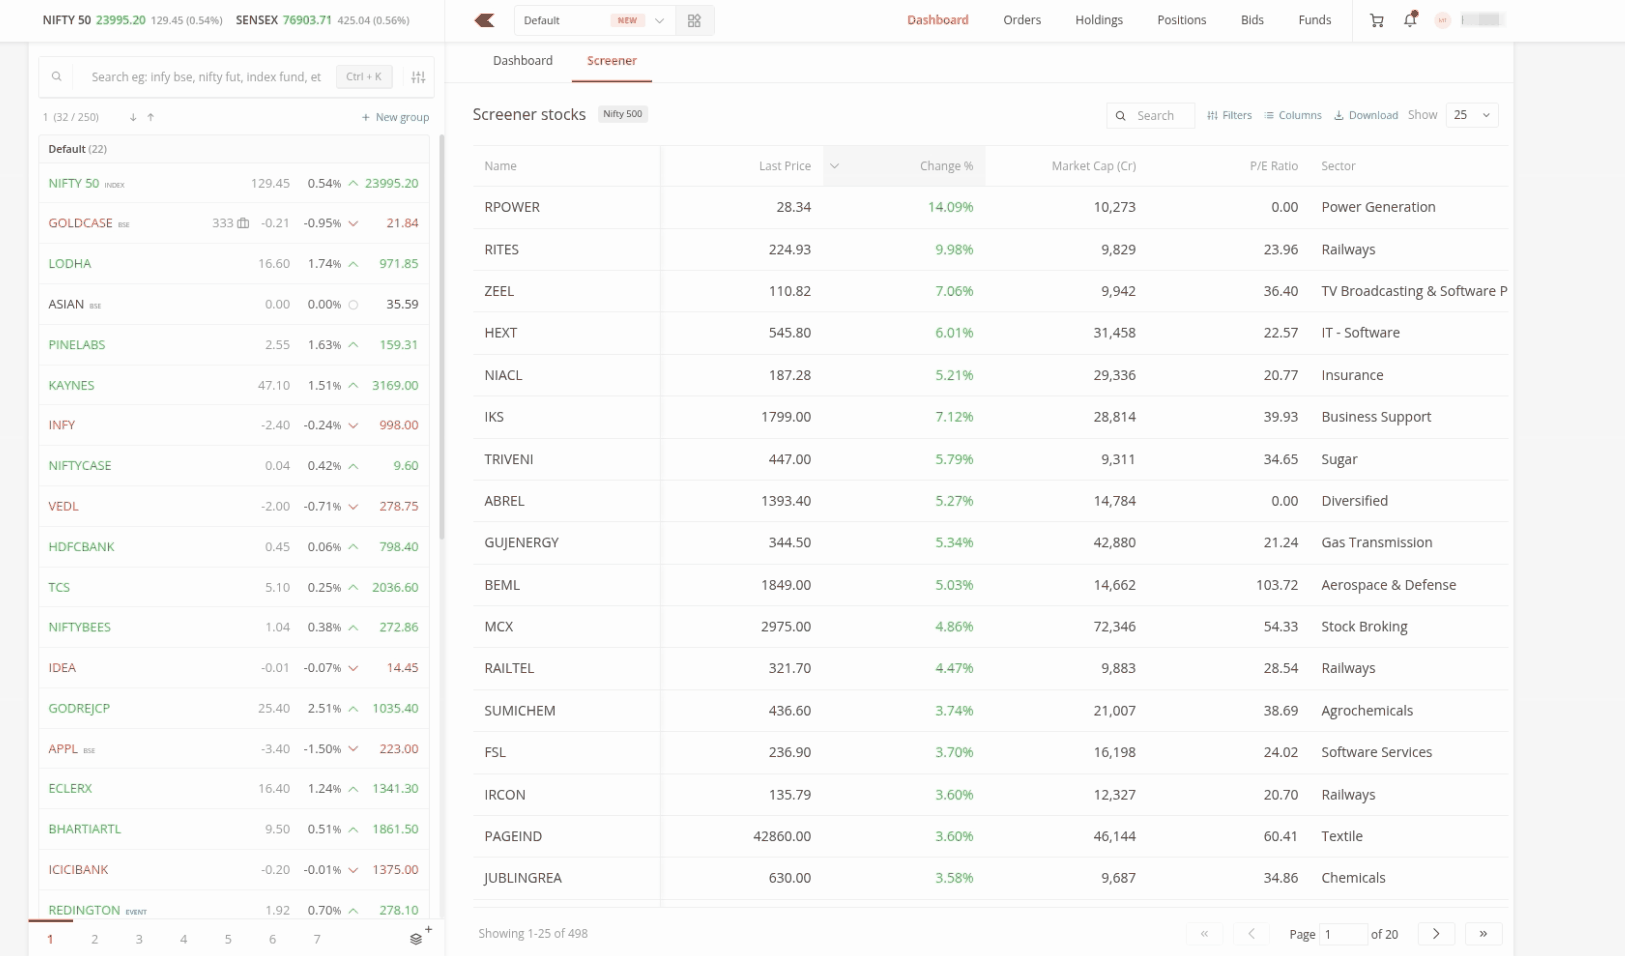
You can inspect any stock directly inside the Kite screener and act on it without leaving the page. Once you filter down to the stocks you want, you can expand a row for a financial snapshot, open the full market depth to place an order, use the context menu for charts and alerts, and preview screens from your Kite dashboard.
How to view stock details
Each stock row in the results table has a small arrow. When you click on it, the row expands inline to show a full financial snapshot of that stock. The expanded view has four sections:
- Basic Info shows the ISIN (International Securities Identification Number), Sector, Segment, and Market capitalisation.
- Fundamentals shows the P/E (Price to Earnings) ratio, Return on Equity, Debt to Equity, Dividend Yield, and Free Cash Flow.
- Price and Volume shows the Last Price, Volume, and the total Buy and Sell quantities for the day.
- Growth Metrics shows the absolute Change, Percentage change, Revenue Growth year-on-year, and Profit Growth year-on-year.
Below these sections, a price slider shows the 52-week low and 52-week high at either end, with a marker showing where the current price sits. The Open, High, Low, and Previous Close appear just above it.
How to place orders from the screener
When you click on the stock name, the full market depth view opens.
Here you see live bid and ask prices, five levels deep on each side, with order counts and quantities. Below that, you see the Volume, Average Price, Lower Circuit, Upper Circuit, LTQ (Last Traded Quantity), and LTT (Last Traded Time). At the bottom, three action buttons appear: Create GTT (Good Till Triggered order), Buy, and Sell, so you can act on a stock directly from the Screener.
Using the context menu
When you click on the three dots next to any stock, a context menu opens with the following options:
- Chart and Option chain, at the top. When you click on either one, it loads on the same screen. If you prefer a multi-window setup, use the pop-out button to open it in a separate tab, along with your open positions and open orders windows.
- Create a GTT, Set an alert, or Market depth, which shows the stacked buy and sell orders.
- Add to marketwatch or Add to basket, for when you want to track a stock or place a multi-leg order.
- Fundamentals and Technicals, for a deeper look at the company and its price action. Within the Fundamentals window, you can click on the fundamentals page shortcut to open a more comprehensive dashboard.
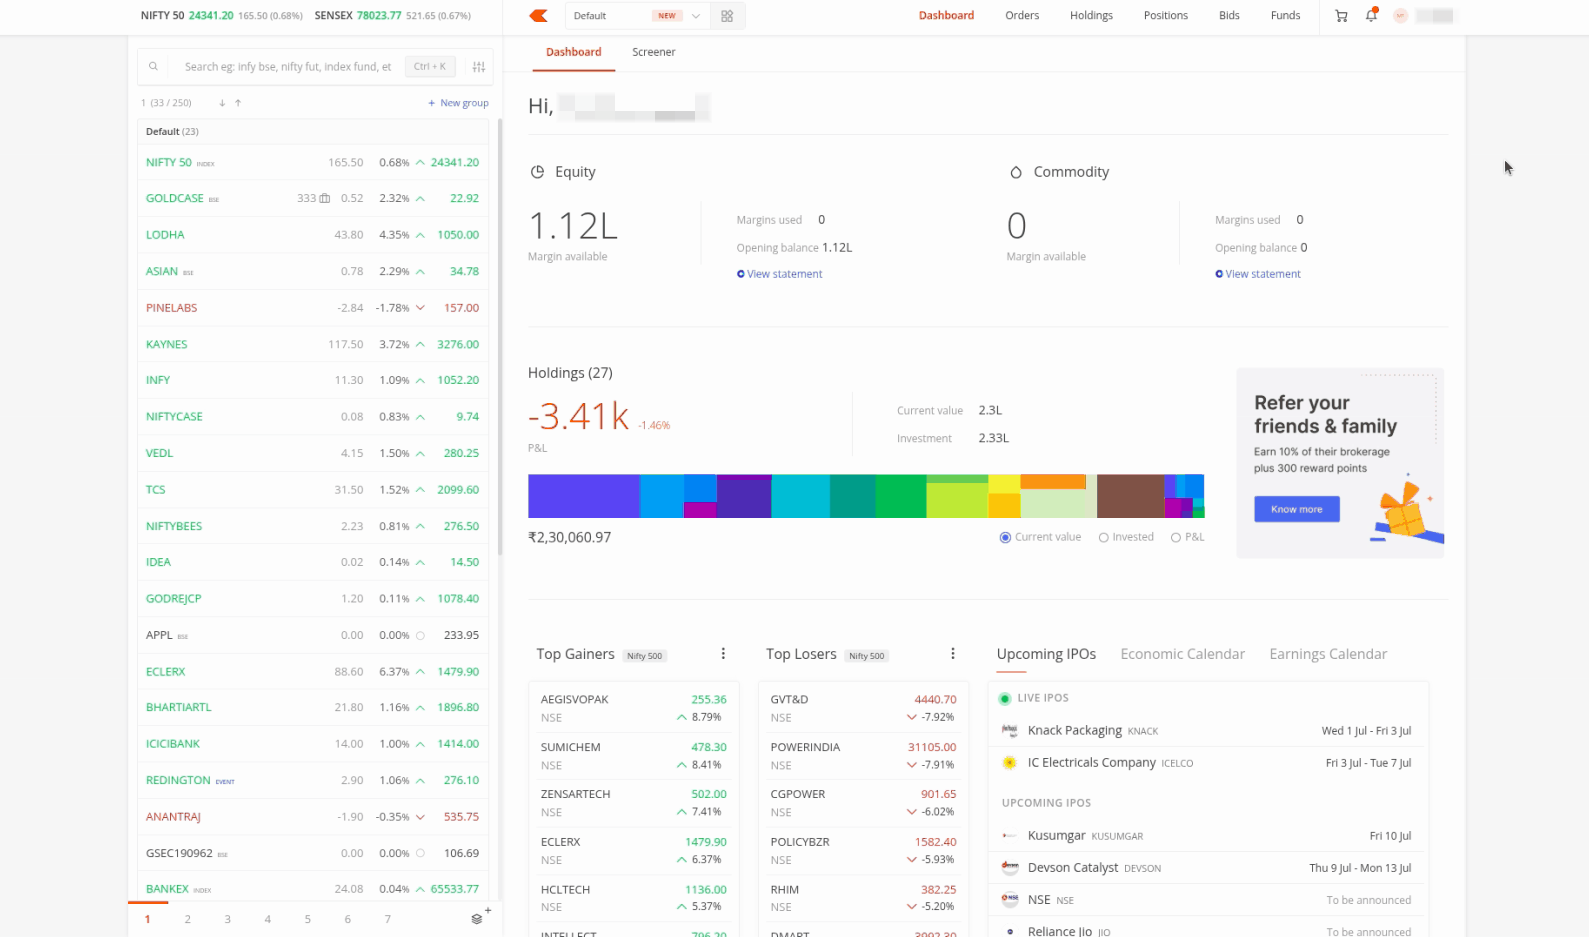
Screener preview on your Kite dashboard
You can also view a screener preview directly on your Kite dashboard. The preview defaults to the top gainers and top losers from Nifty 500, so the moment you open Kite, you know what is moving without opening the Screener tab. To switch the preview to any other preset strategy, click on the three-dot menu here.
When you hover over any stock in the list, a three-dot icon appears, and clicking on it opens the same context menu described above. Clicking on a stock name opens the same market depth view, so you can inspect bids and offers and place trades without leaving your dashboard.